Tutorial: K562 HCT116 SP1 single-cell calling cards data.
In this tutorial, we will analyze the binding of the transcription factor Sp1 in K562 and HCT116 cell lines. These data are generated using single-cell calling cards (scCCs). The data is from Moudgil et al., Cell. (2020) and can be downloaded from GEO.
We will cover how to call TF peaks using a background file, annotate these peaks, compare them with Chip-seq reference data, and perform a differential peak analysis.
[1]:
import pycallingcards as cc
import numpy as np
import pandas as pd
import scanpy as sc
from matplotlib import pyplot as plt
plt.rcParams['figure.dpi'] = 150
We start by reading the qbed datafile. In this file, each row represents a Sp1-directed insertion and columns indicate the chromosome, start point and end point, reads number, the direction and cell barcode of each insertion. For example, the first row tells us the first insertion is on Chromosome 1 in a TTAA site located at genomic coordinates 30116 to 30120. There are 12 reads supporting this insertion, which maps to the negative strand of the genome. The cell barcode is CCCAATCCATCGGTTA-1. Note that the cell barcode allows us to connect this insertino to scRNA-seq data collected from the same cell.
Use cc.rd.read_qbed(filename) to read your own ccf data.
[2]:
# read in experiement data
HCT116_SP1 = cc.datasets.SP1_K562HCT116_data(data = "HCT116_SP1_qbed")
HCT116_SP1
[2]:
| Chr | Start | End | Reads | Direction | Barcodes | |
|---|---|---|---|---|---|---|
| 0 | chr1 | 30116 | 30120 | 5 | - | CCCAATCCATCGGTTA-1 |
| 1 | chr1 | 34568 | 34572 | 3 | - | CCTTCGAAGGGCTTCC-1 |
| 2 | chr1 | 36736 | 36740 | 29 | + | ACGAGCCGTATAGGTA-1 |
| 3 | chr1 | 42447 | 42451 | 3 | - | CTCTACGTCGGAGCAA-1 |
| 4 | chr1 | 89697 | 89701 | 119 | - | AGCTCTCGTTTGTTTC-1 |
| ... | ... | ... | ... | ... | ... | ... |
| 77205 | chrY | 25518788 | 25518792 | 2 | + | TGGGCGTTCGAACGGA-1 |
| 77206 | chrY | 56987633 | 56987637 | 13 | + | CAGTCCTAGGCACATG-1 |
| 77207 | chrY | 57080855 | 57080859 | 17 | + | CGGAGCTCATCGACGC-1 |
| 77208 | chrY | 57080855 | 57080859 | 7 | + | GTAACGTAGTTACGGG-1 |
| 77209 | chrY | 57080855 | 57080859 | 9 | + | TCAGCAAGTTGAACTC-1 |
77210 rows × 6 columns
[3]:
# read in backgound data
HCT116_brd4 = cc.datasets.SP1_K562HCT116_data(data="HCT116_brd4_qbed")
HCT116_brd4
[3]:
| Chr | Start | End | Reads | Direction | Barcodes | |
|---|---|---|---|---|---|---|
| 0 | chr1 | 89697 | 89701 | 14 | + | TCTGAGACAATGGTCT-1 |
| 1 | chr1 | 89697 | 89701 | 8 | + | CAGCGACCAAATACAG-1 |
| 2 | chr1 | 203932 | 203936 | 99 | + | TTCTCCTTCTACTTAC-1 |
| 3 | chr1 | 204063 | 204067 | 5 | - | TGTTCCGGTGTAAGTA-1 |
| 4 | chr1 | 204063 | 204067 | 7 | - | CAAGATCTCGACCAGC-1 |
| ... | ... | ... | ... | ... | ... | ... |
| 37769 | chrY | 18037315 | 18037319 | 9 | - | GCAGTTAAGATCTGAA-1 |
| 37770 | chrY | 24036504 | 24036508 | 168 | + | GCAGTTAAGATCTGAA-1 |
| 37771 | chrY | 24036504 | 24036508 | 508 | + | CATATGGCAGCCAGAA-1 |
| 37772 | chrY | 25633622 | 25633626 | 13 | - | GCAGTTAAGATCTGAA-1 |
| 37773 | chrY | 25633622 | 25633626 | 32 | - | CATATGGCAGCCAGAA-1 |
37774 rows × 6 columns
We first need to call peaks in order to find candidate SP1 binding sites. There are three different methods (CCcaller, MACCs, Blockify) available in Pycallingcards. Here, we will use MACCs to call peaks. The appropriate reference genome for these data is human(‘hg38’). The window_size parameter is the most important parameter for MACCs, it is highly related to the length of a peak. A value of 1000-2000 is recommended for most sequence-specific TFs. step_size is another important parameter and it controls whether two nearby clusters of insertions are called as one peak or split into two peaks. 500-800 is good for step_size. pvalue_cutoffTTAA is the pvalue cutoff for TTAA data and pvalue_cutoffbg is the pvalue cutoff for the background ccf data. Normally, the setting for pvalue_cutoffbg is considerably higher than pvalue_cutoffTTAA. pvalue_cutoffbg is recommended to be 0.1 and pvalue_cutoffTTAA is recommended from 0.001 to 0.05. pseudocounts is advised to be 0.1-1.
[4]:
peak_data_HCT116 = cc.pp.call_peaks(HCT116_SP1, HCT116_brd4, method = "MACCs", reference = "hg38",  window_size = 2000, step_size = 500,
                  pvalue_cutoffTTAA = 0.001, pvalue_cutoffbg = 0.1, lam_win_size = None,  pseudocounts = 0.1, record = True, save = "peak_HCT116.bed")
peak_data_HCT116
For the MACCs method with background, [expdata, background, reference, pvalue_cutoffbg, pvalue_cutoffTTAA, lam_win_size, window_size, step_size, extend, pseudocounts, test_method, min_insertions, record] would be utilized.
100%|██████████| 25/25 [00:43<00:00, 1.75s/it]
[4]:
| Chr | Start | End | Center | Experiment Insertions | Background insertions | Reference Insertions | pvalue Reference | pvalue Background | Fraction Experiment | TPH Experiment | Fraction background | TPH background | TPH background subtracted | pvalue_adj Reference | |
|---|---|---|---|---|---|---|---|---|---|---|---|---|---|---|---|
| 0 | chr1 | 906689 | 907160 | 906957.0 | 5 | 0 | 3 | 3.099334e-09 | 1.546531e-04 | 0.000065 | 6475.845098 | 0.000000 | 0.000000 | 6475.845098 | 3.371990e-06 |
| 1 | chr1 | 999921 | 1000324 | 1000121.0 | 20 | 0 | 1 | 0.000000e+00 | 0.000000e+00 | 0.000259 | 25903.380391 | 0.000000 | 0.000000 | 25903.380391 | 0.000000e+00 |
| 2 | chr1 | 1156947 | 1157863 | 1157660.0 | 11 | 0 | 2 | 0.000000e+00 | 1.274899e-09 | 0.000142 | 14246.859215 | 0.000000 | 0.000000 | 14246.859215 | 0.000000e+00 |
| 3 | chr1 | 1692740 | 1693542 | 1693339.0 | 6 | 0 | 3 | 5.135270e-11 | 1.546531e-04 | 0.000078 | 7771.014117 | 0.000000 | 0.000000 | 7771.014117 | 7.604315e-08 |
| 4 | chr1 | 1744492 | 1746808 | 1746605.0 | 11 | 0 | 7 | 0.000000e+00 | 1.274899e-09 | 0.000142 | 14246.859215 | 0.000000 | 0.000000 | 14246.859215 | 0.000000e+00 |
| ... | ... | ... | ... | ... | ... | ... | ... | ... | ... | ... | ... | ... | ... | ... | ... |
| 3003 | chrY | 1245503 | 1247177 | 1245703.0 | 5 | 0 | 7 | 1.652897e-09 | 4.678840e-03 | 0.000065 | 6475.845098 | 0.000000 | 0.000000 | 6475.845098 | 2.056405e-06 |
| 3004 | chrY | 1280372 | 1281989 | 1281786.0 | 5 | 0 | 3 | 1.426995e-09 | 4.678840e-03 | 0.000065 | 6475.845098 | 0.000000 | 0.000000 | 6475.845098 | 1.828173e-06 |
| 3005 | chrY | 1586317 | 1587733 | 1587530.0 | 7 | 0 | 8 | 3.370637e-13 | 1.546531e-04 | 0.000091 | 9066.183137 | 0.000000 | 0.000000 | 9066.183137 | 6.766326e-10 |
| 3006 | chrY | 2391936 | 2392440 | 2392237.0 | 6 | 1 | 2 | 1.985434e-11 | 9.958372e-02 | 0.000078 | 7771.014117 | 0.000026 | 2647.323556 | 5123.690561 | 3.329699e-08 |
| 3007 | chrY | 2608793 | 2610054 | 2608993.0 | 8 | 0 | 2 | 2.775558e-15 | 1.546531e-04 | 0.000104 | 10361.352156 | 0.000000 | 0.000000 | 10361.352156 | 6.730626e-12 |
3008 rows × 15 columns
In order to tune parameters for peak calling, we advise looking at the data and evaluating the validity of the called peaks. The default settings are recommended, but for some TFs, adjacent peaks may be merged that should not be, or, alternatively, peaks that should be joined may be called separately.
Below, we plot the scCC data in HCT116 cells for a region in chromosome 1. The top track displays the locations of Sp1-directed (red) and background (grey) transpositions and their read counts. Each dot represents an insertion and the height is log(reads+1). The middle track plots the insertion density. The third track represents the reference genes and peaks. Finally, the last track represents peak calls. Below you can see that regions with high densities of insertions are accurately called as Sp1 binding sites.
[5]:
cc.pl.draw_area("chr1",999921,1000324,20000,peak_data_HCT116, HCT116_SP1, "hg38", HCT116_brd4, font_size=2,
                figsize = (30,10), peak_line = 1, save = False, plotsize = [1,1,4], example_length = 1000)
We can also visualize our data directly in the WashU Epigenome Browser. This can be useful for overlaying your data with other published datasets. Notice that this link only valid for 24hrs, so please rerun it if you want to use it.
[6]:
qbed = {"SP1":HCT116_SP1, "Brd4": HCT116_brd4}
bed = {"peak":peak_data_HCT116}
cc.pl.WashU_browser_url(qbed = qbed,bed = bed,genome = 'hg38')
All qbed addressed
All bed addressed
Uploading files
Please click the following link to see the data on WashU Epigenome Browser directly.
https://epigenomegateway.wustl.edu/browser/?genome=hg38&hub=https://companion.epigenomegateway.org//task/cb339e5b2d8c774345b7cf372cf4f97c/output//datahub.json
Pycallingcards can be used to visual peak locations acorss the genome to see that the distribution of peaks is unbiased and that all chromosomes are represented.
[7]:
cc.pl.whole_peaks(peak_data_HCT116, reference = "hg38", figsize=(100, 70), height_scale = 1.7)
We can then analyze the scCC Sp1 peaks to see if there is an enrichment of ChIP-seq signal at these locations using a reference Chip-seq dataset of SP1 binding in HCT116 from ENCSR000BSF (use the bigWig file ENCFF587ZMX generated by it).
Download the data, if needed, with:
!wget https://www.encodeproject.org/files/ENCFF587ZMX/@@download/ENCFF587ZMX.bigWig
We first calculate the signal of the Chip-seq signal around the peak.
[8]:
mtx_HCT116 = cc.pl.calculate_signal(peak_data_HCT116,
                                    chipseq_signal = "ENCFF587ZMX.bigWig")
100%|██████████| 3008/3008 [00:14<00:00, 200.91it/s]
Visualize it by the plotting the signal values.
[9]:
cc.pl.signal_plot(mtx_HCT116, alpha = 0.05, figsize=(6, 4))
Visualized by the plotting the signal heatmap plot.
[10]:
cc.pl.signal_heatmap(mtx_HCT116,pad = 0.035)
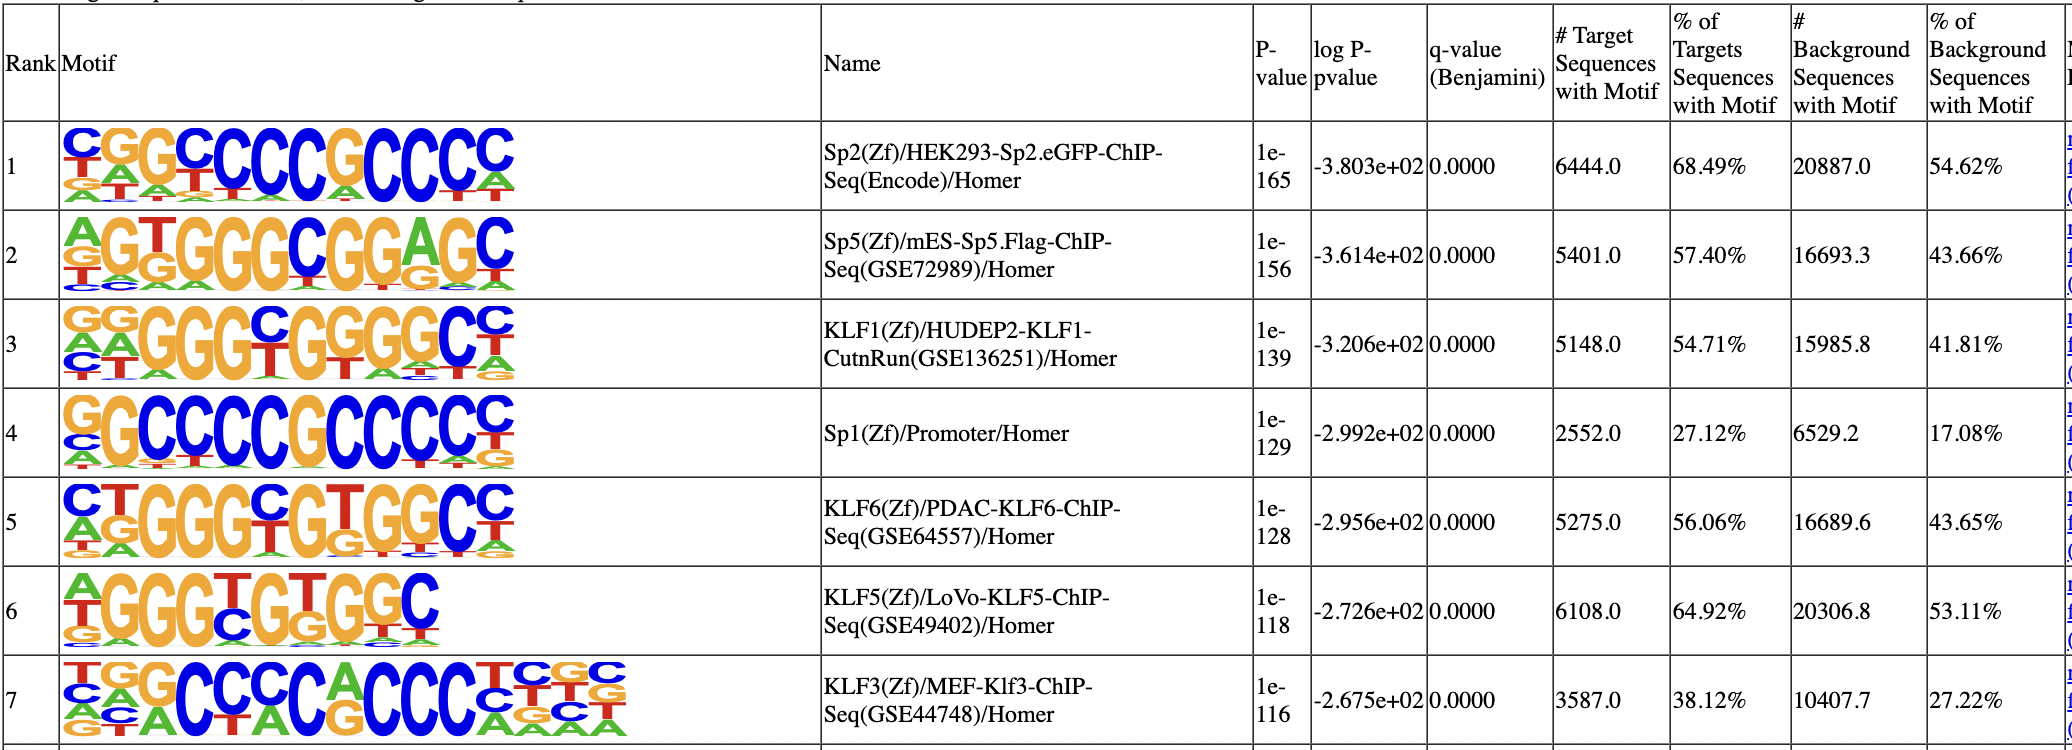
We can now use HOMER to call motifs. We hope to find the canonical Sp1 motif enriched under the call peaks.
[11]:
cc.tl.call_motif("peak_HCT116.bed",reference ="hg38",save_homer = "Homer/peak_HCT116",
                 homer_path = "/home/juanru/miniconda3/bin/", num_cores=12)
Peak data peak_HCT116.bed is used here.
        Position file = peak_HCT116.bed
        Genome = hg38
        Output Directory = Homer/peak_HCT116
        Fragment size set to 1000
        Using 12 CPUs
        Will not run homer for de novo motifs
        Found mset for "human", will check against vertebrates motifs
        Peak/BED file conversion summary:
                BED/Header formatted lines: 3008
                peakfile formatted lines: 0

        Peak File Statistics:
                Total Peaks: 3008
                Redundant Peak IDs: 0
                Peaks lacking information: 0 (need at least 5 columns per peak)
                Peaks with misformatted coordinates: 0 (should be integer)
                Peaks with misformatted strand: 0 (should be either +/- or 0/1)

        Peak file looks good!

        Background files for 1000 bp fragments found.
        Custom genome sequence directory: /home/juanru/miniconda3/share/homer/.//data/genomes/hg38//

        Extracting sequences from file: /home/juanru/miniconda3/share/homer/.//data/genomes/hg38///genome.fa
        Looking for peak sequences in a single file (/home/juanru/miniconda3/share/homer/.//data/genomes/hg38///genome.fa)
        Extracting 334 sequences from chr1
        Extracting 147 sequences from chr10
        Extracting 132 sequences from chr11
        Extracting 179 sequences from chr12
        Extracting 56 sequences from chr13
        Extracting 85 sequences from chr14
        Extracting 83 sequences from chr15
        Extracting 127 sequences from chr16
        Extracting 205 sequences from chr17
        Extracting 54 sequences from chr18
        Extracting 249 sequences from chr19
        Extracting 194 sequences from chr2
        Extracting 71 sequences from chr20
        Extracting 37 sequences from chr21
        Extracting 63 sequences from chr22
        Extracting 143 sequences from chr3
        Extracting 146 sequences from chr4
        Extracting 96 sequences from chr5
        Extracting 159 sequences from chr6
        Extracting 143 sequences from chr7
        Extracting 117 sequences from chr8
        Extracting 136 sequences from chr9
        Extracting 47 sequences from chrX
        Extracting 5 sequences from chrY

        Not removing redundant sequences


        Sequences processed:
                Auto detected maximum sequence length of 1001 bp
                3008 total

        Frequency Bins: 0.2 0.25 0.3 0.35 0.4 0.45 0.5 0.6 0.7 0.8
        Freq    Bin     Count
        0.3     2       1
        0.35    3       46
        0.4     4       183
        0.45    5       336
        0.5     6       476
        0.6     7       1116
        0.7     8       706
        0.8     9       142
        10      10      2

        Total sequences set to 50000

        Choosing background that matches in CpG/GC content...
        Bin     # Targets       # Background    Background Weight
        2       1       16      0.976
        3       46      719     0.999
        4       183     2859    1.000
        5       336     5249    1.000
        6       476     7436    1.000
        7       1116    17435   1.000
        8       706     11029   1.000
        9       142     2218    1.000
        10      2       31      1.008
        Assembling sequence file...
        Normalizing lower order oligos using homer2

        Reading input files...
        50000 total sequences read
        Autonormalization: 1-mers (4 total)
                A       22.98%  23.24%  0.989
                C       27.02%  26.76%  1.010
                G       27.02%  26.76%  1.010
                T       22.98%  23.24%  0.989
        Autonormalization: 2-mers (16 total)
                AA      6.71%   6.20%   1.082
                CA      6.45%   7.36%   0.876
                GA      5.97%   6.11%   0.977
                TA      3.85%   3.56%   1.081
                AC      4.73%   4.90%   0.965
                CC      8.95%   8.75%   1.023
                GC      7.37%   7.01%   1.051
                TC      5.97%   6.11%   0.977
                AG      7.19%   7.61%   0.944
                CG      4.43%   3.06%   1.451
                GG      8.95%   8.75%   1.023
                TG      6.45%   7.36%   0.876
                AT      4.36%   4.52%   0.964
                CT      7.19%   7.61%   0.944
                GT      4.73%   4.90%   0.965
                TT      6.71%   6.20%   1.082
        Autonormalization: 3-mers (64 total)
        Normalization weights can be found in file: Homer/peak_HCT116/seq.autonorm.tsv
        Converging on autonormalization solution:
        ...............................................................................
        Final normalization:    Autonormalization: 1-mers (4 total)
                A       22.98%  22.93%  1.002
                C       27.02%  27.07%  0.998
                G       27.02%  27.07%  0.998
                T       22.98%  22.93%  1.002
        Autonormalization: 2-mers (16 total)
                AA      6.71%   6.50%   1.032
                CA      6.45%   6.69%   0.965
                GA      5.97%   5.97%   1.000
                TA      3.85%   3.78%   1.020
                AC      4.73%   4.71%   1.003
                CC      8.95%   8.89%   1.007
                GC      7.37%   7.50%   0.983
                TC      5.97%   5.97%   1.000
                AG      7.19%   7.21%   0.997
                CG      4.43%   4.29%   1.035
                GG      8.95%   8.89%   1.007
                TG      6.45%   6.69%   0.965
                AT      4.36%   4.51%   0.966
                CT      7.19%   7.21%   0.997
                GT      4.73%   4.71%   1.003
                TT      6.71%   6.50%   1.032
        Autonormalization: 3-mers (64 total)
        Finished preparing sequence/group files

        ----------------------------------------------------------
        Known motif enrichment

        Reading input files...
        50000 total sequences read
        440 motifs loaded
        Cache length = 11180
        Using binomial scoring
        Checking enrichment of 440 motif(s)
        |0%                                    50%                                  100%|
        =================================================================================
Finished!
        Preparing HTML output with sequence logos...
                1 of 440 (1e-105) Sp5(Zf)/mES-Sp5.Flag-ChIP-Seq(GSE72989)/Homer
                2 of 440 (1e-97) KLF3(Zf)/MEF-Klf3-ChIP-Seq(GSE44748)/Homer
                3 of 440 (1e-92) Sp1(Zf)/Promoter/Homer
                4 of 440 (1e-87) KLF1(Zf)/HUDEP2-KLF1-CutnRun(GSE136251)/Homer
                5 of 440 (1e-78) Sp2(Zf)/HEK293-Sp2.eGFP-ChIP-Seq(Encode)/Homer
                6 of 440 (1e-77) Klf9(Zf)/GBM-Klf9-ChIP-Seq(GSE62211)/Homer
                7 of 440 (1e-69) KLF6(Zf)/PDAC-KLF6-ChIP-Seq(GSE64557)/Homer
                8 of 440 (1e-68) KLF5(Zf)/LoVo-KLF5-ChIP-Seq(GSE49402)/Homer
                9 of 440 (1e-65) KLF14(Zf)/HEK293-KLF14.GFP-ChIP-Seq(GSE58341)/Homer
                10 of 440 (1e-62) Maz(Zf)/HepG2-Maz-ChIP-Seq(GSE31477)/Homer
                11 of 440 (1e-58) Klf4(Zf)/mES-Klf4-ChIP-Seq(GSE11431)/Homer
                12 of 440 (1e-51) Jun-AP1(bZIP)/K562-cJun-ChIP-Seq(GSE31477)/Homer
                13 of 440 (1e-50) Fosl2(bZIP)/3T3L1-Fosl2-ChIP-Seq(GSE56872)/Homer
                14 of 440 (1e-43) TATA-Box(TBP)/Promoter/Homer
                15 of 440 (1e-42) Fra2(bZIP)/Striatum-Fra2-ChIP-Seq(GSE43429)/Homer
                16 of 440 (1e-41) Fra1(bZIP)/BT549-Fra1-ChIP-Seq(GSE46166)/Homer
                17 of 440 (1e-41) Fos(bZIP)/TSC-Fos-ChIP-Seq(GSE110950)/Homer
                18 of 440 (1e-41) JunB(bZIP)/DendriticCells-Junb-ChIP-Seq(GSE36099)/Homer
                19 of 440 (1e-37) Atf3(bZIP)/GBM-ATF3-ChIP-Seq(GSE33912)/Homer
                20 of 440 (1e-35) KLF10(Zf)/HEK293-KLF10.GFP-ChIP-Seq(GSE58341)/Homer
                21 of 440 (1e-30) BATF(bZIP)/Th17-BATF-ChIP-Seq(GSE39756)/Homer
                22 of 440 (1e-28) AP-1(bZIP)/ThioMac-PU.1-ChIP-Seq(GSE21512)/Homer
                23 of 440 (1e-25) Bach2(bZIP)/OCILy7-Bach2-ChIP-Seq(GSE44420)/Homer
                24 of 440 (1e-22) Pitx1(Homeobox)/Chicken-Pitx1-ChIP-Seq(GSE38910)/Homer
                25 of 440 (1e-20) Elk4(ETS)/Hela-Elk4-ChIP-Seq(GSE31477)/Homer
                26 of 440 (1e-19) E2F4(E2F)/K562-E2F4-ChIP-Seq(GSE31477)/Homer
                27 of 440 (1e-19) Hoxd11(Homeobox)/ChickenMSG-Hoxd11.Flag-ChIP-Seq(GSE86088)/Homer
                28 of 440 (1e-18) Nkx6.1(Homeobox)/Islet-Nkx6.1-ChIP-Seq(GSE40975)/Homer
                29 of 440 (1e-18) Hoxa13(Homeobox)/ChickenMSG-Hoxa13.Flag-ChIP-Seq(GSE86088)/Homer
                30 of 440 (1e-17) WT1(Zf)/Kidney-WT1-ChIP-Seq(GSE90016)/Homer
                31 of 440 (1e-16) Fli1(ETS)/CD8-FLI-ChIP-Seq(GSE20898)/Homer
                32 of 440 (1e-16) Hoxa11(Homeobox)/ChickenMSG-Hoxa11.Flag-ChIP-Seq(GSE86088)/Homer
                33 of 440 (1e-16) Isl1(Homeobox)/Neuron-Isl1-ChIP-Seq(GSE31456)/Homer
                34 of 440 (1e-15) Elk1(ETS)/Hela-Elk1-ChIP-Seq(GSE31477)/Homer
                35 of 440 (1e-15) Egr1(Zf)/K562-Egr1-ChIP-Seq(GSE32465)/Homer
                36 of 440 (1e-15) E2F6(E2F)/Hela-E2F6-ChIP-Seq(GSE31477)/Homer
                37 of 440 (1e-15) ETV4(ETS)/HepG2-ETV4-ChIP-Seq(ENCODE)/Homer
                38 of 440 (1e-15) EKLF(Zf)/Erythrocyte-Klf1-ChIP-Seq(GSE20478)/Homer
                39 of 440 (1e-14) Egr2(Zf)/Thymocytes-Egr2-ChIP-Seq(GSE34254)/Homer
                40 of 440 (1e-13) ZNF467(Zf)/HEK293-ZNF467.GFP-ChIP-Seq(GSE58341)/Homer
                41 of 440 (1e-12) E2F3(E2F)/MEF-E2F3-ChIP-Seq(GSE71376)/Homer
                42 of 440 (1e-11) ELF1(ETS)/Jurkat-ELF1-ChIP-Seq(SRA014231)/Homer
                43 of 440 (1e-11) Nrf2(bZIP)/Lymphoblast-Nrf2-ChIP-Seq(GSE37589)/Homer
                44 of 440 (1e-11) Unknown(Homeobox)/Limb-p300-ChIP-Seq/Homer
                45 of 440 (1e-10) Lhx1(Homeobox)/EmbryoCarcinoma-Lhx1-ChIP-Seq(GSE70957)/Homer
                46 of 440 (1e-10) E2F1(E2F)/Hela-E2F1-ChIP-Seq(GSE22478)/Homer
                47 of 440 (1e-10) En1(Homeobox)/SUM149-EN1-ChIP-Seq(GSE120957)/Homer
                48 of 440 (1e-9) Lhx3(Homeobox)/Neuron-Lhx3-ChIP-Seq(GSE31456)/Homer
                49 of 440 (1e-9) CRX(Homeobox)/Retina-Crx-ChIP-Seq(GSE20012)/Homer
                50 of 440 (1e-8) Zfp281(Zf)/ES-Zfp281-ChIP-Seq(GSE81042)/Homer
                51 of 440 (1e-8) GABPA(ETS)/Jurkat-GABPa-ChIP-Seq(GSE17954)/Homer
                52 of 440 (1e-8) NF-E2(bZIP)/K562-NFE2-ChIP-Seq(GSE31477)/Homer
                53 of 440 (1e-8) Hoxd13(Homeobox)/ChickenMSG-Hoxd13.Flag-ChIP-Seq(GSE86088)/Homer
                54 of 440 (1e-8) HIF-1b(HLH)/T47D-HIF1b-ChIP-Seq(GSE59937)/Homer
                55 of 440 (1e-8) ETV1(ETS)/GIST48-ETV1-ChIP-Seq(GSE22441)/Homer
                56 of 440 (1e-7) LHX9(Homeobox)/Hct116-LHX9.V5-ChIP-Seq(GSE116822)/Homer
                57 of 440 (1e-7) DLX2(Homeobox)/BasalGanglia-Dlx2-ChIP-seq(GSE124936)/Homer
                58 of 440 (1e-7) Bach1(bZIP)/K562-Bach1-ChIP-Seq(GSE31477)/Homer
                59 of 440 (1e-7) DLX1(Homeobox)/BasalGanglia-Dlx1-ChIP-seq(GSE124936)/Homer
                60 of 440 (1e-7) EHF(ETS)/LoVo-EHF-ChIP-Seq(GSE49402)/Homer
                61 of 440 (1e-7) BMYB(HTH)/Hela-BMYB-ChIP-Seq(GSE27030)/Homer
                62 of 440 (1e-7) NFE2L2(bZIP)/HepG2-NFE2L2-ChIP-Seq(Encode)/Homer
                63 of 440 (1e-7) Stat3(Stat)/mES-Stat3-ChIP-Seq(GSE11431)/Homer
                64 of 440 (1e-6) Hoxa9(Homeobox)/ChickenMSG-Hoxa9.Flag-ChIP-Seq(GSE86088)/Homer
                65 of 440 (1e-6) MYB(HTH)/ERMYB-Myb-ChIPSeq(GSE22095)/Homer
                66 of 440 (1e-6) Znf263(Zf)/K562-Znf263-ChIP-Seq(GSE31477)/Homer
                67 of 440 (1e-6) HNF1b(Homeobox)/PDAC-HNF1B-ChIP-Seq(GSE64557)/Homer
                68 of 440 (1e-6) CHR(?)/Hela-CellCycle-Expression/Homer
                69 of 440 (1e-6) CTCF(Zf)/CD4+-CTCF-ChIP-Seq(Barski_et_al.)/Homer
                70 of 440 (1e-6) ETS(ETS)/Promoter/Homer
                71 of 440 (1e-6) ETS1(ETS)/Jurkat-ETS1-ChIP-Seq(GSE17954)/Homer
                72 of 440 (1e-6) ZNF652/HepG2-ZNF652.Flag-ChIP-Seq(Encode)/Homer
                73 of 440 (1e-5) Nanog(Homeobox)/mES-Nanog-ChIP-Seq(GSE11724)/Homer
                74 of 440 (1e-5) Lhx2(Homeobox)/HFSC-Lhx2-ChIP-Seq(GSE48068)/Homer
                75 of 440 (1e-5) Elf4(ETS)/BMDM-Elf4-ChIP-Seq(GSE88699)/Homer
                76 of 440 (1e-5) NFY(CCAAT)/Promoter/Homer
                77 of 440 (1e-5) ELF5(ETS)/T47D-ELF5-ChIP-Seq(GSE30407)/Homer
                78 of 440 (1e-5) AP-2gamma(AP2)/MCF7-TFAP2C-ChIP-Seq(GSE21234)/Homer
                79 of 440 (1e-5) ERG(ETS)/VCaP-ERG-ChIP-Seq(GSE14097)/Homer
                80 of 440 (1e-5) EWS:ERG-fusion(ETS)/CADO_ES1-EWS:ERG-ChIP-Seq(SRA014231)/Homer
                81 of 440 (1e-5) AMYB(HTH)/Testes-AMYB-ChIP-Seq(GSE44588)/Homer
                82 of 440 (1e-5) ELF3(ETS)/PDAC-ELF3-ChIP-Seq(GSE64557)/Homer
                83 of 440 (1e-5) HOXB13(Homeobox)/ProstateTumor-HOXB13-ChIP-Seq(GSE56288)/Homer
                84 of 440 (1e-5) STAT4(Stat)/CD4-Stat4-ChIP-Seq(GSE22104)/Homer
                85 of 440 (1e-5) MafK(bZIP)/C2C12-MafK-ChIP-Seq(GSE36030)/Homer
                86 of 440 (1e-4) SPDEF(ETS)/VCaP-SPDEF-ChIP-Seq(SRA014231)/Homer
                87 of 440 (1e-4) Ets1-distal(ETS)/CD4+-PolII-ChIP-Seq(Barski_et_al.)/Homer
                88 of 440 (1e-4) DLX5(Homeobox)/BasalGanglia-Dlx5-ChIP-seq(GSE124936)/Homer
                89 of 440 (1e-4) Dlx3(Homeobox)/Kerainocytes-Dlx3-ChIP-Seq(GSE89884)/Homer
                90 of 440 (1e-4) PRDM15(Zf)/ESC-Prdm15-ChIP-Seq(GSE73694)/Homer
                91 of 440 (1e-4) Stat3+il21(Stat)/CD4-Stat3-ChIP-Seq(GSE19198)/Homer
                92 of 440 (1e-4) Etv2(ETS)/ES-ER71-ChIP-Seq(GSE59402)/Homer
                93 of 440 (1e-4) HIF2a(bHLH)/785_O-HIF2a-ChIP-Seq(GSE34871)/Homer
                94 of 440 (1e-4) TEAD1(TEAD)/HepG2-TEAD1-ChIP-Seq(Encode)/Homer
                95 of 440 (1e-3) ZNF189(Zf)/HEK293-ZNF189.GFP-ChIP-Seq(GSE58341)/Homer
                96 of 440 (1e-3) STAT5(Stat)/mCD4+-Stat5-ChIP-Seq(GSE12346)/Homer
                97 of 440 (1e-3) AP-2alpha(AP2)/Hela-AP2alpha-ChIP-Seq(GSE31477)/Homer
                98 of 440 (1e-3) ZFX(Zf)/mES-Zfx-ChIP-Seq(GSE11431)/Homer
                99 of 440 (1e-3) NFkB-p65-Rel(RHD)/ThioMac-LPS-Expression(GSE23622)/Homer
                100 of 440 (1e-3) BORIS(Zf)/K562-CTCFL-ChIP-Seq(GSE32465)/Homer
                101 of 440 (1e-3) E2F7(E2F)/Hela-E2F7-ChIP-Seq(GSE32673)/Homer
                102 of 440 (1e-3) EWS:FLI1-fusion(ETS)/SK_N_MC-EWS:FLI1-ChIP-Seq(SRA014231)/Homer
                103 of 440 (1e-3) c-Myc(bHLH)/LNCAP-cMyc-ChIP-Seq(Unpublished)/Homer
                104 of 440 (1e-3) Otx2(Homeobox)/EpiLC-Otx2-ChIP-Seq(GSE56098)/Homer
                105 of 440 (1e-3) TEAD4(TEA)/Tropoblast-Tead4-ChIP-Seq(GSE37350)/Homer
                106 of 440 (1e-2) Npas4(bHLH)/Neuron-Npas4-ChIP-Seq(GSE127793)/Homer
                107 of 440 (1e-2) CArG(MADS)/PUER-Srf-ChIP-Seq(Sullivan_et_al.)/Homer
                108 of 440 (1e-2) ZNF711(Zf)/SHSY5Y-ZNF711-ChIP-Seq(GSE20673)/Homer
                109 of 440 (1e-2) Prop1(Homeobox)/GHFT1-PROP1.biotin-ChIP-Seq(GSE77302)/Homer
                110 of 440 (1e-2) GSC(Homeobox)/FrogEmbryos-GSC-ChIP-Seq(DRA000576)/Homer
                111 of 440 (1e-2) Hnf1(Homeobox)/Liver-Foxa2-Chip-Seq(GSE25694)/Homer
                112 of 440 (1e-2) TRPS1(Zf)/MCF7-TRPS1-ChIP-Seq(GSE107013)/Homer
                113 of 440 (1e-2) Tbr1(T-box)/Cortex-Tbr1-ChIP-Seq(GSE71384)/Homer
                114 of 440 (1e-2) NFAT(RHD)/Jurkat-NFATC1-ChIP-Seq(Jolma_et_al.)/Homer
                115 of 440 (1e-2) CLOCK(bHLH)/Liver-Clock-ChIP-Seq(GSE39860)/Homer
                116 of 440 (1e-2) STAT1(Stat)/HelaS3-STAT1-ChIP-Seq(GSE12782)/Homer
                117 of 440 (1e-2) Barx1(Homeobox)/Stomach-Barx1.3xFlag-ChIP-Seq(GSE69483)/Homer
                118 of 440 (1e-2) NFkB-p65(RHD)/GM12787-p65-ChIP-Seq(GSE19485)/Homer
                119 of 440 (1e-2) CEBP(bZIP)/ThioMac-CEBPb-ChIP-Seq(GSE21512)/Homer
                120 of 440 (1e-2) Arnt:Ahr(bHLH)/MCF7-Arnt-ChIP-Seq(Lo_et_al.)/Homer
                121 of 440 (1e-2) HINFP(Zf)/K562-HINFP.eGFP-ChIP-Seq(Encode)/Homer
                122 of 440 (1e-2) CRE(bZIP)/Promoter/Homer
                123 of 440 (1e-2) E-box(bHLH)/Promoter/Homer
                124 of 440 (1e-2) Hoxd12(Homeobox)/ChickenMSG-Hoxd12.Flag-ChIP-Seq(GSE86088)/Homer
                125 of 440 (1e-2) TEAD(TEA)/Fibroblast-PU.1-ChIP-Seq(Unpublished)/Homer
                126 of 440 (1e-2) ZSCAN22(Zf)/HEK293-ZSCAN22.GFP-ChIP-Seq(GSE58341)/Homer
                127 of 440 (1e-2) IRF:BATF(IRF:bZIP)/pDC-Irf8-ChIP-Seq(GSE66899)/Homer
                128 of 440 (1e-2) CDX4(Homeobox)/ZebrafishEmbryos-Cdx4.Myc-ChIP-Seq(GSE48254)/Homer
        Skipping...
        Job finished - if results look good, please send beer to ..

        Cleaning up tmp files...
In the motif analysis result, SP1 motif and many other family members rank top.
Do the exact same thing for K562 SP1 data.
[12]:
# read experiment data
K562_SP1 = cc.datasets.SP1_K562HCT116_data(data="K562_SP1_qbed")
K562_SP1
[12]:
| Chr | Start | End | Reads | Direction | Barcodes | |
|---|---|---|---|---|---|---|
| 0 | chr1 | 16529 | 16533 | 163 | - | GCTCCTAAGTACGTTC-1 |
| 1 | chr1 | 29884 | 29888 | 10 | + | CTCACACCAGACGCTC-1 |
| 2 | chr1 | 29884 | 29888 | 155 | + | TGGCCAGCACCCATTC-1 |
| 3 | chr1 | 29884 | 29888 | 285 | + | GTGGGTCCACGGCCAT-1 |
| 4 | chr1 | 29884 | 29888 | 7 | + | CGTCTACTCAACACGT-1 |
| ... | ... | ... | ... | ... | ... | ... |
| 327460 | chrY | 57061562 | 57061566 | 6 | + | CTCATTATCATCATTC-1 |
| 327461 | chrY | 57061562 | 57061566 | 67 | + | TGCGTGGCATTAGGCT-1 |
| 327462 | chrY | 57145084 | 57145088 | 2 | - | ACATACGTCGCGCCAA-1 |
| 327463 | chrY | 57148630 | 57148634 | 2 | - | TATGCCCGTACAGTTC-1 |
| 327464 | chrY | 57183913 | 57183917 | 228 | - | AAACCTGGTCCTGCTT-1 |
327465 rows × 6 columns
[13]:
# read background data
K562_brd4 =cc.datasets.SP1_K562HCT116_data(data="K562_brd4_qbed")
K562_brd4
[13]:
| Chr | Start | End | Reads | Direction | Barcodes | |
|---|---|---|---|---|---|---|
| 0 | chr1 | 30238 | 30242 | 3 | + | TTTACTGCATAAAGGT-1 |
| 1 | chr1 | 30355 | 30359 | 2 | - | ATCACGAAGAGTAATC-1 |
| 2 | chr1 | 30355 | 30359 | 70 | + | TTGAACGCAAATCCGT-1 |
| 3 | chr1 | 31101 | 31105 | 2 | + | CCTCAGTCATCAGTAC-1 |
| 4 | chr1 | 32116 | 32120 | 5 | + | CTAGTGAAGACAAAGG-1 |
| ... | ... | ... | ... | ... | ... | ... |
| 107380 | chrY | 57080210 | 57080214 | 9 | - | AAGGAGCCAGTATAAG-1 |
| 107381 | chrY | 57087785 | 57087789 | 24 | - | CGAGCCAGTCTCTCTG-1 |
| 107382 | chrY | 57144853 | 57144857 | 5 | + | GAAGCAGTCCCATTTA-1 |
| 107383 | chrY | 57183772 | 57183776 | 2 | - | TCTTTCCTCTTGCCGT-1 |
| 107384 | chrY | 57204853 | 57204857 | 369 | - | ATAACGCAGTTTGCGT-1 |
107385 rows × 6 columns
[14]:
peak_data_K562 = cc.pp.call_peaks(K562_SP1, K562_brd4, method = "MACCs", reference = "hg38", window_size = 2000, step_size = 500,
                  pvalue_cutoffTTAA = 0.0001,  pvalue_cutoffbg = 0.1, lam_win_size = None,  pseudocounts = 0.1, record = True, save = "peak_k562.bed")
peak_data_K562
For the MACCs method with background, [expdata, background, reference, pvalue_cutoffbg, pvalue_cutoffTTAA, lam_win_size, window_size, step_size, extend, pseudocounts, test_method, min_insertions, record] would be utilized.
100%|██████████| 24/24 [01:34<00:00, 3.96s/it]
[14]:
| Chr | Start | End | Center | Experiment Insertions | Background insertions | Reference Insertions | pvalue Reference | pvalue Background | Fraction Experiment | TPH Experiment | Fraction background | TPH background | TPH background subtracted | pvalue_adj Reference | |
|---|---|---|---|---|---|---|---|---|---|---|---|---|---|---|---|
| 0 | chr1 | 29684 | 30087 | 29884.0 | 6 | 0 | 1 | 8.878753e-11 | 1.546531e-04 | 0.000018 | 1832.256882 | 0.000000 | 0.000000 | 1832.256882 | 3.323285e-08 |
| 1 | chr1 | 36239 | 38107 | 37578.0 | 24 | 2 | 15 | 0.000000e+00 | 1.486029e-03 | 0.000073 | 7329.027530 | 0.000019 | 1862.457513 | 5466.570017 | 0.000000e+00 |
| 2 | chr1 | 198893 | 201208 | 200869.0 | 28 | 2 | 11 | 0.000000e+00 | 6.927041e-05 | 0.000086 | 8550.532118 | 0.000019 | 1862.457513 | 6688.074605 | 0.000000e+00 |
| 3 | chr1 | 203351 | 207161 | 205004.0 | 92 | 13 | 22 | 0.000000e+00 | 4.337485e-05 | 0.000281 | 28094.605530 | 0.000121 | 12105.973832 | 15988.631698 | 0.000000e+00 |
| 4 | chr1 | 265549 | 266336 | 265749.0 | 5 | 0 | 3 | 3.731359e-08 | 4.678840e-03 | 0.000015 | 1526.880735 | 0.000000 | 0.000000 | 1526.880735 | 1.056034e-05 |
| ... | ... | ... | ... | ... | ... | ... | ... | ... | ... | ... | ... | ... | ... | ... | ... |
| 9404 | chrY | 15158250 | 15158653 | 15158450.0 | 11 | 0 | 1 | 0.000000e+00 | 1.546531e-04 | 0.000034 | 3359.137618 | 0.000000 | 0.000000 | 3359.137618 | 0.000000e+00 |
| 9405 | chrY | 16985442 | 16985845 | 16985642.0 | 5 | 0 | 2 | 1.806731e-09 | 4.678840e-03 | 0.000015 | 1526.880735 | 0.000000 | 0.000000 | 1526.880735 | 6.060202e-07 |
| 9406 | chrY | 19753311 | 19753714 | 19753511.0 | 33 | 0 | 1 | 0.000000e+00 | 2.269296e-13 | 0.000101 | 10077.412853 | 0.000000 | 0.000000 | 10077.412853 | 0.000000e+00 |
| 9407 | chrY | 21011133 | 21011828 | 21011333.0 | 5 | 0 | 4 | 2.510448e-09 | 4.678840e-03 | 0.000015 | 1526.880735 | 0.000000 | 0.000000 | 1526.880735 | 8.296735e-07 |
| 9408 | chrY | 56952574 | 56957328 | 56953707.0 | 40 | 1 | 37 | 0.000000e+00 | 2.427052e-06 | 0.000122 | 12215.045883 | 0.000009 | 931.228756 | 11283.817126 | 0.000000e+00 |
9409 rows × 15 columns
[15]:
cc.pl.draw_area("chr10",3048452,3049913,60000,peak_data_K562,K562_SP1, "hg38", K562_brd4 , font_size=2,
                figsize = (30,15),peak_line = 4,save = False,bins =400, plotsize = [1,1,5], example_length = 1000)
[16]:
qbed = {"SP1":K562_SP1, "Brd4": K562_brd4}
bed = {"peak":peak_data_K562}
cc.pl.WashU_browser_url(qbed = qbed,bed = bed,genome = 'hg38')
All qbed addressed
All bed addressed
Uploading files
Please click the following link to see the data on WashU Epigenome Browser directly.
https://epigenomegateway.wustl.edu/browser/?genome=hg38&hub=https://companion.epigenomegateway.org//task/db6498ca05ea546a0938a34cd8de001c/output//datahub.json
[17]:
cc.pl.whole_peaks(peak_data_K562, reference = "hg38",figsize=(100, 70),height_scale = 1.7)
We can see that SP1 binds much more frequently in K562 than HCT116.
We can then check with reference Chip-seq data of SP1 in K562 from ENCSR372IML (and use the bigWig file ENCFF588UII generated by it).
Download the data if needed:
!wget https://www.encodeproject.org/files/ENCFF588UII/@@download/ENCFF588UII.bigWig
[18]:
mtx_K562 = cc.pl.calculate_signal(peak_data_K562, chipseq_signal = "ENCFF588UII.bigWig")
100%|██████████| 9409/9409 [00:41<00:00, 225.34it/s]
[19]:
cc.pl.signal_plot(mtx_K562, alpha = 0.05, figsize=(6, 4))
[20]:
cc.pl.signal_heatmap(mtx_K562,pad = 0.023, belowlength = 100)
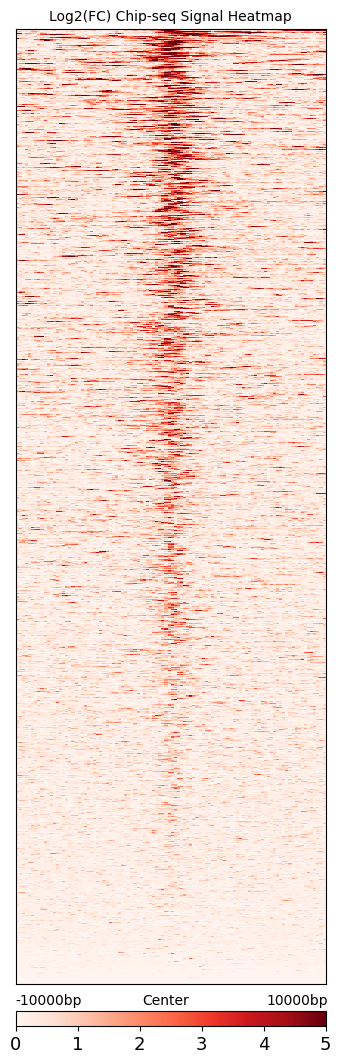
We can see that calling cards peaks are consistent with Chip-seq data. Peak centers tend to have a higher signal and the signal goes lower as the distance increases.
Call motif to check the peak results.
[21]:
cc.tl.call_motif("peak_k562.bed",reference ="hg38",save_homer = "Homer/peak_k562",
                 homer_path = "/home/juanru/miniconda3/bin/", num_cores=12)
Peak data peak_k562.bed is used here.
        Position file = peak_k562.bed
        Genome = hg38
        Output Directory = Homer/peak_k562
        Fragment size set to 1000
        Using 12 CPUs
        Will not run homer for de novo motifs
        Found mset for "human", will check against vertebrates motifs
        Peak/BED file conversion summary:
                BED/Header formatted lines: 9409
                peakfile formatted lines: 0

        Peak File Statistics:
                Total Peaks: 9409
                Redundant Peak IDs: 2
                Peaks lacking information: 0 (need at least 5 columns per peak)
                Peaks with misformatted coordinates: 0 (should be integer)
                Peaks with misformatted strand: 0 (should be either +/- or 0/1)

        Redunant Peaks found: Remove or rename these or some programs may have trouble...

        2 duplicate peak IDs out of 9409 total peaks
        Background files for 1000 bp fragments found.
        Custom genome sequence directory: /home/juanru/miniconda3/share/homer/.//data/genomes/hg38//

        Extracting sequences from file: /home/juanru/miniconda3/share/homer/.//data/genomes/hg38///genome.fa
        Looking for peak sequences in a single file (/home/juanru/miniconda3/share/homer/.//data/genomes/hg38///genome.fa)
        Extracting 1062 sequences from chr1
        Extracting 426 sequences from chr10
        Extracting 475 sequences from chr11
        Extracting 443 sequences from chr12
        Extracting 182 sequences from chr13
        Extracting 227 sequences from chr14
        Extracting 302 sequences from chr15
        Extracting 342 sequences from chr16
        Extracting 409 sequences from chr17
        Extracting 169 sequences from chr18
        Extracting 505 sequences from chr19
        Extracting 660 sequences from chr2
        Extracting 249 sequences from chr20
        Extracting 154 sequences from chr21
        Extracting 186 sequences from chr22
        Extracting 508 sequences from chr3
        Extracting 428 sequences from chr4
        Extracting 408 sequences from chr5
        Extracting 620 sequences from chr6
        Extracting 572 sequences from chr7
        Extracting 375 sequences from chr8
        Extracting 408 sequences from chr9
        Extracting 281 sequences from chrX
        Extracting 18 sequences from chrY

        Not removing redundant sequences


        Sequences processed:
                Auto detected maximum sequence length of 1001 bp
                9409 total

        Frequency Bins: 0.2 0.25 0.3 0.35 0.4 0.45 0.5 0.6 0.7 0.8
        Freq    Bin     Count
        0.3     2       52
        0.35    3       412
        0.4     4       1127
        0.45    5       1812
        0.5     6       1961
        0.6     7       2657
        0.7     8       1164
        0.8     9       219
        10      10      5

        Total sequences set to 50000

        Choosing background that matches in CpG/GC content...
        Bin     # Targets       # Background    Background Weight
        2       52      224     1.001
        3       412     1777    1.000
        4       1127    4862    1.000
        5       1812    7817    1.000
        6       1961    8460    1.000
        7       2657    11462   1.000
        8       1164    5022    1.000
        9       219     945     1.000
        10      5       22      0.980
        Assembling sequence file...
        Normalizing lower order oligos using homer2

        Reading input files...
        50000 total sequences read
        Autonormalization: 1-mers (4 total)
                A       25.36%  25.49%  0.995
                C       24.64%  24.51%  1.005
                G       24.64%  24.51%  1.005
                T       25.36%  25.49%  0.995
        Autonormalization: 2-mers (16 total)
                AA      7.80%   7.45%   1.047
                CA      6.85%   7.40%   0.925
                GA      6.01%   6.09%   0.986
                TA      4.70%   4.54%   1.036
                AC      4.92%   4.99%   0.986
                CC      7.54%   7.44%   1.013
                GC      6.17%   5.99%   1.029
                TC      6.01%   6.09%   0.986
                AG      7.26%   7.47%   0.972
                CG      2.98%   2.20%   1.356
                GG      7.54%   7.44%   1.013
                TG      6.85%   7.40%   0.925
                AT      5.37%   5.57%   0.966
                CT      7.26%   7.47%   0.972
                GT      4.92%   4.99%   0.986
                TT      7.80%   7.45%   1.047
        Autonormalization: 3-mers (64 total)
        Normalization weights can be found in file: Homer/peak_k562/seq.autonorm.tsv
        Converging on autonormalization solution:
        ...............................................................................
        Final normalization:    Autonormalization: 1-mers (4 total)
                A       25.36%  25.34%  1.001
                C       24.64%  24.66%  0.999
                G       24.64%  24.66%  0.999
                T       25.36%  25.34%  1.001
        Autonormalization: 2-mers (16 total)
                AA      7.80%   7.68%   1.016
                CA      6.85%   6.98%   0.982
                GA      6.01%   6.00%   1.000
                TA      4.70%   4.67%   1.006
                AC      4.92%   4.88%   1.008
                CC      7.54%   7.52%   1.002
                GC      6.17%   6.25%   0.987
                TC      6.01%   6.00%   1.000
                AG      7.26%   7.24%   1.003
                CG      2.98%   2.92%   1.023
                GG      7.54%   7.52%   1.002
                TG      6.85%   6.98%   0.982
                AT      5.37%   5.53%   0.971
                CT      7.26%   7.24%   1.003
                GT      4.92%   4.88%   1.008
                TT      7.80%   7.68%   1.016
        Autonormalization: 3-mers (64 total)
        Finished preparing sequence/group files

        ----------------------------------------------------------
        Known motif enrichment

        Reading input files...
        50000 total sequences read
        440 motifs loaded
        Cache length = 11180
        Using binomial scoring
        Checking enrichment of 440 motif(s)
        |0%                                    50%                                  100%|
        =================================================================================
Finished!
        Preparing HTML output with sequence logos...
                1 of 440 (1e-169) Sp2(Zf)/HEK293-Sp2.eGFP-ChIP-Seq(Encode)/Homer
                2 of 440 (1e-148) Sp5(Zf)/mES-Sp5.Flag-ChIP-Seq(GSE72989)/Homer
                3 of 440 (1e-137) KLF1(Zf)/HUDEP2-KLF1-CutnRun(GSE136251)/Homer
                4 of 440 (1e-125) KLF6(Zf)/PDAC-KLF6-ChIP-Seq(GSE64557)/Homer
                5 of 440 (1e-124) KLF5(Zf)/LoVo-KLF5-ChIP-Seq(GSE49402)/Homer
                6 of 440 (1e-123) Sp1(Zf)/Promoter/Homer
                7 of 440 (1e-114) KLF3(Zf)/MEF-Klf3-ChIP-Seq(GSE44748)/Homer
                8 of 440 (1e-114) Maz(Zf)/HepG2-Maz-ChIP-Seq(GSE31477)/Homer
                9 of 440 (1e-100) KLF14(Zf)/HEK293-KLF14.GFP-ChIP-Seq(GSE58341)/Homer
                10 of 440 (1e-96) Klf9(Zf)/GBM-Klf9-ChIP-Seq(GSE62211)/Homer
                11 of 440 (1e-74) Jun-AP1(bZIP)/K562-cJun-ChIP-Seq(GSE31477)/Homer
                12 of 440 (1e-67) Gata2(Zf)/K562-GATA2-ChIP-Seq(GSE18829)/Homer
                13 of 440 (1e-65) Fosl2(bZIP)/3T3L1-Fosl2-ChIP-Seq(GSE56872)/Homer
                14 of 440 (1e-61) TATA-Box(TBP)/Promoter/Homer
                15 of 440 (1e-60) Gata4(Zf)/Heart-Gata4-ChIP-Seq(GSE35151)/Homer
                16 of 440 (1e-59) Gata6(Zf)/HUG1N-GATA6-ChIP-Seq(GSE51936)/Homer
                17 of 440 (1e-57) Bach2(bZIP)/OCILy7-Bach2-ChIP-Seq(GSE44420)/Homer
                18 of 440 (1e-52) BMYB(HTH)/Hela-BMYB-ChIP-Seq(GSE27030)/Homer
                19 of 440 (1e-52) GATA3(Zf)/iTreg-Gata3-ChIP-Seq(GSE20898)/Homer
                20 of 440 (1e-48) Fra2(bZIP)/Striatum-Fra2-ChIP-Seq(GSE43429)/Homer
                21 of 440 (1e-47) Klf4(Zf)/mES-Klf4-ChIP-Seq(GSE11431)/Homer
                22 of 440 (1e-46) Gata1(Zf)/K562-GATA1-ChIP-Seq(GSE18829)/Homer
                23 of 440 (1e-45) Fos(bZIP)/TSC-Fos-ChIP-Seq(GSE110950)/Homer
                24 of 440 (1e-45) JunB(bZIP)/DendriticCells-Junb-ChIP-Seq(GSE36099)/Homer
                25 of 440 (1e-43) Fra1(bZIP)/BT549-Fra1-ChIP-Seq(GSE46166)/Homer
                26 of 440 (1e-41) AMYB(HTH)/Testes-AMYB-ChIP-Seq(GSE44588)/Homer
                27 of 440 (1e-39) TRPS1(Zf)/MCF7-TRPS1-ChIP-Seq(GSE107013)/Homer
                28 of 440 (1e-36) MYB(HTH)/ERMYB-Myb-ChIPSeq(GSE22095)/Homer
                29 of 440 (1e-36) KLF10(Zf)/HEK293-KLF10.GFP-ChIP-Seq(GSE58341)/Homer
                30 of 440 (1e-36) Atf3(bZIP)/GBM-ATF3-ChIP-Seq(GSE33912)/Homer
                31 of 440 (1e-35) Bach1(bZIP)/K562-Bach1-ChIP-Seq(GSE31477)/Homer
                32 of 440 (1e-34) BATF(bZIP)/Th17-BATF-ChIP-Seq(GSE39756)/Homer
                33 of 440 (1e-33) NF-E2(bZIP)/K562-NFE2-ChIP-Seq(GSE31477)/Homer
                34 of 440 (1e-33) Pitx1(Homeobox)/Chicken-Pitx1-ChIP-Seq(GSE38910)/Homer
                35 of 440 (1e-32) WT1(Zf)/Kidney-WT1-ChIP-Seq(GSE90016)/Homer
                36 of 440 (1e-32) Elk4(ETS)/Hela-Elk4-ChIP-Seq(GSE31477)/Homer
                37 of 440 (1e-28) Isl1(Homeobox)/Neuron-Isl1-ChIP-Seq(GSE31456)/Homer
                38 of 440 (1e-27) AP-1(bZIP)/ThioMac-PU.1-ChIP-Seq(GSE21512)/Homer
                39 of 440 (1e-27) Nrf2(bZIP)/Lymphoblast-Nrf2-ChIP-Seq(GSE37589)/Homer
                40 of 440 (1e-26) Elk1(ETS)/Hela-Elk1-ChIP-Seq(GSE31477)/Homer
                41 of 440 (1e-24) ZNF467(Zf)/HEK293-ZNF467.GFP-ChIP-Seq(GSE58341)/Homer
                42 of 440 (1e-23) NFE2L2(bZIP)/HepG2-NFE2L2-ChIP-Seq(Encode)/Homer
                43 of 440 (1e-23) E2F6(E2F)/Hela-E2F6-ChIP-Seq(GSE31477)/Homer
                44 of 440 (1e-23) CTCF(Zf)/CD4+-CTCF-ChIP-Seq(Barski_et_al.)/Homer
                45 of 440 (1e-23) ETV4(ETS)/HepG2-ETV4-ChIP-Seq(ENCODE)/Homer
                46 of 440 (1e-23) Fli1(ETS)/CD8-FLI-ChIP-Seq(GSE20898)/Homer
                47 of 440 (1e-23) Egr1(Zf)/K562-Egr1-ChIP-Seq(GSE32465)/Homer
                48 of 440 (1e-22) GATA:SCL(Zf,bHLH)/Ter119-SCL-ChIP-Seq(GSE18720)/Homer
                49 of 440 (1e-21) Egr2(Zf)/Thymocytes-Egr2-ChIP-Seq(GSE34254)/Homer
                50 of 440 (1e-21) Zfp281(Zf)/ES-Zfp281-ChIP-Seq(GSE81042)/Homer
                51 of 440 (1e-20) ETV1(ETS)/GIST48-ETV1-ChIP-Seq(GSE22441)/Homer
                52 of 440 (1e-19) Elf4(ETS)/BMDM-Elf4-ChIP-Seq(GSE88699)/Homer
                53 of 440 (1e-19) Nkx6.1(Homeobox)/Islet-Nkx6.1-ChIP-Seq(GSE40975)/Homer
                54 of 440 (1e-18) ZNF652/HepG2-ZNF652.Flag-ChIP-Seq(Encode)/Homer
                55 of 440 (1e-18) Hoxa13(Homeobox)/ChickenMSG-Hoxa13.Flag-ChIP-Seq(GSE86088)/Homer
                56 of 440 (1e-16) Znf263(Zf)/K562-Znf263-ChIP-Seq(GSE31477)/Homer
                57 of 440 (1e-15) E2F4(E2F)/K562-E2F4-ChIP-Seq(GSE31477)/Homer
                58 of 440 (1e-15) ELF1(ETS)/Jurkat-ELF1-ChIP-Seq(SRA014231)/Homer
                59 of 440 (1e-15) EKLF(Zf)/Erythrocyte-Klf1-ChIP-Seq(GSE20478)/Homer
                60 of 440 (1e-14) GABPA(ETS)/Jurkat-GABPa-ChIP-Seq(GSE17954)/Homer
                61 of 440 (1e-13) CRX(Homeobox)/Retina-Crx-ChIP-Seq(GSE20012)/Homer
                62 of 440 (1e-13) Lhx3(Homeobox)/Neuron-Lhx3-ChIP-Seq(GSE31456)/Homer
                63 of 440 (1e-12) Hoxa11(Homeobox)/ChickenMSG-Hoxa11.Flag-ChIP-Seq(GSE86088)/Homer
                64 of 440 (1e-11) STAT5(Stat)/mCD4+-Stat5-ChIP-Seq(GSE12346)/Homer
                65 of 440 (1e-11) ETS1(ETS)/Jurkat-ETS1-ChIP-Seq(GSE17954)/Homer
                66 of 440 (1e-11) ZNF317(Zf)/HEK293-ZNF317.GFP-ChIP-Seq(GSE58341)/Homer
                67 of 440 (1e-11) En1(Homeobox)/SUM149-EN1-ChIP-Seq(GSE120957)/Homer
                68 of 440 (1e-10) BORIS(Zf)/K562-CTCFL-ChIP-Seq(GSE32465)/Homer
                69 of 440 (1e-10) MITF(bHLH)/MastCells-MITF-ChIP-Seq(GSE48085)/Homer
                70 of 440 (1e-10) RORg(NR)/Liver-Rorc-ChIP-Seq(GSE101115)/Homer
                71 of 440 (1e-10) Hoxd13(Homeobox)/ChickenMSG-Hoxd13.Flag-ChIP-Seq(GSE86088)/Homer
                72 of 440 (1e-10) EHF(ETS)/LoVo-EHF-ChIP-Seq(GSE49402)/Homer
                73 of 440 (1e-10) EWS:FLI1-fusion(ETS)/SK_N_MC-EWS:FLI1-ChIP-Seq(SRA014231)/Homer
                74 of 440 (1e-9) RXR(NR),DR1/3T3L1-RXR-ChIP-Seq(GSE13511)/Homer
                75 of 440 (1e-9) ELF5(ETS)/T47D-ELF5-ChIP-Seq(GSE30407)/Homer
                76 of 440 (1e-9) PU.1(ETS)/ThioMac-PU.1-ChIP-Seq(GSE21512)/Homer
                77 of 440 (1e-9) FOXK2(Forkhead)/U2OS-FOXK2-ChIP-Seq(E-MTAB-2204)/Homer
                78 of 440 (1e-9) Hoxd11(Homeobox)/ChickenMSG-Hoxd11.Flag-ChIP-Seq(GSE86088)/Homer
                79 of 440 (1e-9) PPARa(NR),DR1/Liver-Ppara-ChIP-Seq(GSE47954)/Homer
                80 of 440 (1e-9) PU.1-IRF(ETS:IRF)/Bcell-PU.1-ChIP-Seq(GSE21512)/Homer
                81 of 440 (1e-9) Stat3(Stat)/mES-Stat3-ChIP-Seq(GSE11431)/Homer
                82 of 440 (1e-9) Unknown(Homeobox)/Limb-p300-ChIP-Seq/Homer
                83 of 440 (1e-9) Hoxa9(Homeobox)/ChickenMSG-Hoxa9.Flag-ChIP-Seq(GSE86088)/Homer
                84 of 440 (1e-9) ETS(ETS)/Promoter/Homer
                85 of 440 (1e-8) HIF-1b(HLH)/T47D-HIF1b-ChIP-Seq(GSE59937)/Homer
                86 of 440 (1e-8) Hnf1(Homeobox)/Liver-Foxa2-Chip-Seq(GSE25694)/Homer
                87 of 440 (1e-8) STAT1(Stat)/HelaS3-STAT1-ChIP-Seq(GSE12782)/Homer
                88 of 440 (1e-8) PPARE(NR),DR1/3T3L1-Pparg-ChIP-Seq(GSE13511)/Homer
                89 of 440 (1e-8) Smad4(MAD)/ESC-SMAD4-ChIP-Seq(GSE29422)/Homer
                90 of 440 (1e-8) PR(NR)/T47D-PR-ChIP-Seq(GSE31130)/Homer
                91 of 440 (1e-8) ERG(ETS)/VCaP-ERG-ChIP-Seq(GSE14097)/Homer
                92 of 440 (1e-8) MafK(bZIP)/C2C12-MafK-ChIP-Seq(GSE36030)/Homer
                93 of 440 (1e-8) MafB(bZIP)/BMM-Mafb-ChIP-Seq(GSE75722)/Homer
                94 of 440 (1e-8) FOXP1(Forkhead)/H9-FOXP1-ChIP-Seq(GSE31006)/Homer
                95 of 440 (1e-7) E2F3(E2F)/MEF-E2F3-ChIP-Seq(GSE71376)/Homer
                96 of 440 (1e-7) E2F7(E2F)/Hela-E2F7-ChIP-Seq(GSE32673)/Homer
                97 of 440 (1e-7) Lhx1(Homeobox)/EmbryoCarcinoma-Lhx1-ChIP-Seq(GSE70957)/Homer
                98 of 440 (1e-7) Smad2(MAD)/ES-SMAD2-ChIP-Seq(GSE29422)/Homer
                99 of 440 (1e-7) Nanog(Homeobox)/mES-Nanog-ChIP-Seq(GSE11724)/Homer
                100 of 440 (1e-7) Max(bHLH)/K562-Max-ChIP-Seq(GSE31477)/Homer
                101 of 440 (1e-7) DLX2(Homeobox)/BasalGanglia-Dlx2-ChIP-seq(GSE124936)/Homer
                102 of 440 (1e-7) MafA(bZIP)/Islet-MafA-ChIP-Seq(GSE30298)/Homer
                103 of 440 (1e-7) ZFX(Zf)/mES-Zfx-ChIP-Seq(GSE11431)/Homer
                104 of 440 (1e-7) DLX1(Homeobox)/BasalGanglia-Dlx1-ChIP-seq(GSE124936)/Homer
                105 of 440 (1e-7) E2F1(E2F)/Hela-E2F1-ChIP-Seq(GSE22478)/Homer
                106 of 440 (1e-7) CHR(?)/Hela-CellCycle-Expression/Homer
                107 of 440 (1e-6) Ets1-distal(ETS)/CD4+-PolII-ChIP-Seq(Barski_et_al.)/Homer
                108 of 440 (1e-6) MafF(bZIP)/HepG2-MafF-ChIP-Seq(GSE31477)/Homer
                109 of 440 (1e-6) USF1(bHLH)/GM12878-Usf1-ChIP-Seq(GSE32465)/Homer
                110 of 440 (1e-6) LRF(Zf)/Erythroblasts-ZBTB7A-ChIP-Seq(GSE74977)/Homer
                111 of 440 (1e-6) Foxo3(Forkhead)/U2OS-Foxo3-ChIP-Seq(E-MTAB-2701)/Homer
                112 of 440 (1e-6) SpiB(ETS)/OCILY3-SPIB-ChIP-Seq(GSE56857)/Homer
                113 of 440 (1e-6) p53(p53)/mES-cMyc-ChIP-Seq(GSE11431)/Homer
                114 of 440 (1e-6) Tbox:Smad(T-box,MAD)/ESCd5-Smad2_3-ChIP-Seq(GSE29422)/Homer
                115 of 440 (1e-6) Otx2(Homeobox)/EpiLC-Otx2-ChIP-Seq(GSE56098)/Homer
                116 of 440 (1e-6) MYNN(Zf)/HEK293-MYNN.eGFP-ChIP-Seq(Encode)/Homer
                117 of 440 (1e-6) YY1(Zf)/Promoter/Homer
                118 of 440 (1e-6) SPDEF(ETS)/VCaP-SPDEF-ChIP-Seq(SRA014231)/Homer
                119 of 440 (1e-5) NeuroD1(bHLH)/Islet-NeuroD1-ChIP-Seq(GSE30298)/Homer
                120 of 440 (1e-5) SCL(bHLH)/HPC7-Scl-ChIP-Seq(GSE13511)/Homer
                121 of 440 (1e-5) IRF3(IRF)/BMDM-Irf3-ChIP-Seq(GSE67343)/Homer
                122 of 440 (1e-5) GFY-Staf(?,Zf)/Promoter/Homer
                123 of 440 (1e-5) Foxf1(Forkhead)/Lung-Foxf1-ChIP-Seq(GSE77951)/Homer
                124 of 440 (1e-5) Foxo1(Forkhead)/RAW-Foxo1-ChIP-Seq(Fan_et_al.)/Homer
                125 of 440 (1e-5) CLOCK(bHLH)/Liver-Clock-ChIP-Seq(GSE39860)/Homer
                126 of 440 (1e-5) ETS:E-box(ETS,bHLH)/HPC7-Scl-ChIP-Seq(GSE22178)/Homer
                127 of 440 (1e-5) Atoh1(bHLH)/Cerebellum-Atoh1-ChIP-Seq(GSE22111)/Homer
                128 of 440 (1e-5) Tbr1(T-box)/Cortex-Tbr1-ChIP-Seq(GSE71384)/Homer
                129 of 440 (1e-4) STAT4(Stat)/CD4-Stat4-ChIP-Seq(GSE22104)/Homer
                130 of 440 (1e-4) Sox3(HMG)/NPC-Sox3-ChIP-Seq(GSE33059)/Homer
                131 of 440 (1e-4) c-Myc(bHLH)/LNCAP-cMyc-ChIP-Seq(Unpublished)/Homer
                132 of 440 (1e-4) LHX9(Homeobox)/Hct116-LHX9.V5-ChIP-Seq(GSE116822)/Homer
                133 of 440 (1e-4) ELF3(ETS)/PDAC-ELF3-ChIP-Seq(GSE64557)/Homer
                134 of 440 (1e-4) Stat3+il21(Stat)/CD4-Stat3-ChIP-Seq(GSE19198)/Homer
                135 of 440 (1e-4) DLX5(Homeobox)/BasalGanglia-Dlx5-ChIP-seq(GSE124936)/Homer
                136 of 440 (1e-4) CEBP:AP1(bZIP)/ThioMac-CEBPb-ChIP-Seq(GSE21512)/Homer
                137 of 440 (1e-4) AR-halfsite(NR)/LNCaP-AR-ChIP-Seq(GSE27824)/Homer
                138 of 440 (1e-4) Six1(Homeobox)/Myoblast-Six1-ChIP-Chip(GSE20150)/Homer
                139 of 440 (1e-4) Tcf12(bHLH)/GM12878-Tcf12-ChIP-Seq(GSE32465)/Homer
                140 of 440 (1e-4) CArG(MADS)/PUER-Srf-ChIP-Seq(Sullivan_et_al.)/Homer
                141 of 440 (1e-3) Etv2(ETS)/ES-ER71-ChIP-Seq(GSE59402)/Homer
                142 of 440 (1e-3) Zfp57(Zf)/H1-ZFP57.HA-ChIP-Seq(GSE115387)/Homer
                143 of 440 (1e-3) NFY(CCAAT)/Promoter/Homer
                144 of 440 (1e-3) PU.1:IRF8(ETS:IRF)/pDC-Irf8-ChIP-Seq(GSE66899)/Homer
                145 of 440 (1e-3) NPAS(bHLH)/Liver-NPAS-ChIP-Seq(GSE39860)/Homer
                146 of 440 (1e-3) EWS:ERG-fusion(ETS)/CADO_ES1-EWS:ERG-ChIP-Seq(SRA014231)/Homer
                147 of 440 (1e-3) FOXK1(Forkhead)/HEK293-FOXK1-ChIP-Seq(GSE51673)/Homer
                148 of 440 (1e-3) Zic2(Zf)/ESC-Zic2-ChIP-Seq(SRP197560)/Homer
                149 of 440 (1e-3) MNT(bHLH)/HepG2-MNT-ChIP-Seq(Encode)/Homer
                150 of 440 (1e-3) IRF2(IRF)/Erythroblas-IRF2-ChIP-Seq(GSE36985)/Homer
                151 of 440 (1e-3) Tcf21(bHLH)/ArterySmoothMuscle-Tcf21-ChIP-Seq(GSE61369)/Homer
                152 of 440 (1e-3) BHLHA15(bHLH)/NIH3T3-BHLHB8.HA-ChIP-Seq(GSE119782)/Homer
                153 of 440 (1e-3) Ap4(bHLH)/AML-Tfap4-ChIP-Seq(GSE45738)/Homer
                154 of 440 (1e-3) IRF8(IRF)/BMDM-IRF8-ChIP-Seq(GSE77884)/Homer
                155 of 440 (1e-3) NFAT(RHD)/Jurkat-NFATC1-ChIP-Seq(Jolma_et_al.)/Homer
                156 of 440 (1e-3) Unknown-ESC-element(?)/mES-Nanog-ChIP-Seq(GSE11724)/Homer
                157 of 440 (1e-3) Sox9(HMG)/Limb-SOX9-ChIP-Seq(GSE73225)/Homer
                158 of 440 (1e-3) MyoG(bHLH)/C2C12-MyoG-ChIP-Seq(GSE36024)/Homer
                159 of 440 (1e-3) Six2(Homeobox)/NephronProgenitor-Six2-ChIP-Seq(GSE39837)/Homer
                160 of 440 (1e-3) Lhx2(Homeobox)/HFSC-Lhx2-ChIP-Seq(GSE48068)/Homer
                161 of 440 (1e-3) GSC(Homeobox)/FrogEmbryos-GSC-ChIP-Seq(DRA000576)/Homer
                162 of 440 (1e-3) HNF1b(Homeobox)/PDAC-HNF1B-ChIP-Seq(GSE64557)/Homer
                163 of 440 (1e-3) IRF4(IRF)/GM12878-IRF4-ChIP-Seq(GSE32465)/Homer
                164 of 440 (1e-3) Prop1(Homeobox)/GHFT1-PROP1.biotin-ChIP-Seq(GSE77302)/Homer
                165 of 440 (1e-3) NeuroG2(bHLH)/Fibroblast-NeuroG2-ChIP-Seq(GSE75910)/Homer
                166 of 440 (1e-3) BMAL1(bHLH)/Liver-Bmal1-ChIP-Seq(GSE39860)/Homer
                167 of 440 (1e-3) ZNF189(Zf)/HEK293-ZNF189.GFP-ChIP-Seq(GSE58341)/Homer
                168 of 440 (1e-3) EBF1(EBF)/Near-E2A-ChIP-Seq(GSE21512)/Homer
                169 of 440 (1e-3) HIF2a(bHLH)/785_O-HIF2a-ChIP-Seq(GSE34871)/Homer
                170 of 440 (1e-3) E2F(E2F)/Hela-CellCycle-Expression/Homer
                171 of 440 (1e-2) Rfx6(HTH)/Min6b1-Rfx6.HA-ChIP-Seq(GSE62844)/Homer
                172 of 440 (1e-2) EBF2(EBF)/BrownAdipose-EBF2-ChIP-Seq(GSE97114)/Homer
                173 of 440 (1e-2) Zac1(Zf)/Neuro2A-Plagl1-ChIP-Seq(GSE75942)/Homer
                174 of 440 (1e-2) VDR(NR),DR3/GM10855-VDR+vitD-ChIP-Seq(GSE22484)/Homer
                175 of 440 (1e-2) Rbpj1(?)/Panc1-Rbpj1-ChIP-Seq(GSE47459)/Homer
                176 of 440 (1e-2) STAT6(Stat)/Macrophage-Stat6-ChIP-Seq(GSE38377)/Homer
                177 of 440 (1e-2) Ascl1(bHLH)/NeuralTubes-Ascl1-ChIP-Seq(GSE55840)/Homer
                178 of 440 (1e-2) n-Myc(bHLH)/mES-nMyc-ChIP-Seq(GSE11431)/Homer
                179 of 440 (1e-2) MyoD(bHLH)/Myotube-MyoD-ChIP-Seq(GSE21614)/Homer
                180 of 440 (1e-2) FOXA1(Forkhead)/MCF7-FOXA1-ChIP-Seq(GSE26831)/Homer
                181 of 440 (1e-2) Zfp809(Zf)/ES-Zfp809-ChIP-Seq(GSE70799)/Homer
                182 of 440 (1e-2) Sox21(HMG)/ESC-SOX21-ChIP-Seq(GSE110505)/Homer
                183 of 440 (1e-2) CRE(bZIP)/Promoter/Homer
                184 of 440 (1e-2) RUNX1(Runt)/Jurkat-RUNX1-ChIP-Seq(GSE29180)/Homer
                185 of 440 (1e-2) JunD(bZIP)/K562-JunD-ChIP-Seq/Homer
                186 of 440 (1e-2) Foxa3(Forkhead)/Liver-Foxa3-ChIP-Seq(GSE77670)/Homer
                187 of 440 (1e-2) FOXA1(Forkhead)/LNCAP-FOXA1-ChIP-Seq(GSE27824)/Homer
                188 of 440 (1e-2) ZNF711(Zf)/SHSY5Y-ZNF711-ChIP-Seq(GSE20673)/Homer
                189 of 440 (1e-2) TCF4(bHLH)/SHSY5Y-TCF4-ChIP-Seq(GSE96915)/Homer
                190 of 440 (1e-2) PRDM15(Zf)/ESC-Prdm15-ChIP-Seq(GSE73694)/Homer
                191 of 440 (1e-2) Esrrb(NR)/mES-Esrrb-ChIP-Seq(GSE11431)/Homer
                192 of 440 (1e-2) ZNF692(Zf)/HEK293-ZNF692.GFP-ChIP-Seq(GSE58341)/Homer
                193 of 440 (1e-2) PRDM1(Zf)/Hela-PRDM1-ChIP-Seq(GSE31477)/Homer
                194 of 440 (1e-2) Sox10(HMG)/SciaticNerve-Sox3-ChIP-Seq(GSE35132)/Homer
                195 of 440 (1e-2) Zic(Zf)/Cerebellum-ZIC1.2-ChIP-Seq(GSE60731)/Homer
                196 of 440 (1e-2) PRDM14(Zf)/H1-PRDM14-ChIP-Seq(GSE22767)/Homer
                197 of 440 (1e-2) Myf5(bHLH)/GM-Myf5-ChIP-Seq(GSE24852)/Homer
                198 of 440 (1e-2) Barx1(Homeobox)/Stomach-Barx1.3xFlag-ChIP-Seq(GSE69483)/Homer
                199 of 440 (1e-2) IRF1(IRF)/PBMC-IRF1-ChIP-Seq(GSE43036)/Homer
                200 of 440 (1e-2) AP-2gamma(AP2)/MCF7-TFAP2C-ChIP-Seq(GSE21234)/Homer
                201 of 440 (1e-2) bHLHE40(bHLH)/HepG2-BHLHE40-ChIP-Seq(GSE31477)/Homer
                202 of 440 (1e-2) ZBTB18(Zf)/HEK293-ZBTB18.GFP-ChIP-Seq(GSE58341)/Homer
                203 of 440 (1e-2) TR4(NR),DR1/Hela-TR4-ChIP-Seq(GSE24685)/Homer
                204 of 440 (1e-2) Olig2(bHLH)/Neuron-Olig2-ChIP-Seq(GSE30882)/Homer
                205 of 440 (1e-2) HNF4a(NR),DR1/HepG2-HNF4a-ChIP-Seq(GSE25021)/Homer
                206 of 440 (1e-2) Twist2(bHLH)/Myoblast-Twist2.Ty1-ChIP-Seq(GSE127998)/Homer
                207 of 440 (1e-2) FOXM1(Forkhead)/MCF7-FOXM1-ChIP-Seq(GSE72977)/Homer
                208 of 440 (1e-2) RORgt(NR)/EL4-RORgt.Flag-ChIP-Seq(GSE56019)/Homer
                209 of 440 (1e-2) RORgt(NR)/EL4-RORgt.Flag-ChIP-Seq(GSE56019)/Homer
                210 of 440 (1e-2) STAT6(Stat)/CD4-Stat6-ChIP-Seq(GSE22104)/Homer
                211 of 440 (1e-2) RUNX2(Runt)/PCa-RUNX2-ChIP-Seq(GSE33889)/Homer
                212 of 440 (1e-2) Eomes(T-box)/H9-Eomes-ChIP-Seq(GSE26097)/Homer
                213 of 440 (1e-2) Six4(Homeobox)/MCF7-SIX4-ChIP-Seq(Encode)/Homer
                214 of 440 (1e-2) ZNF341(Zf)/EBV-ZNF341-ChIP-Seq(GSE113194)/Homer
                215 of 440 (1e-2) Foxa2(Forkhead)/Liver-Foxa2-ChIP-Seq(GSE25694)/Homer
        Skipping...
        Job finished - if results look good, please send beer to ..

        Cleaning up tmp files...
In the motif analysis result, SP1 motif and many other family members rank top.
Next we want to identify binding sites that are differentially bound in K562 and Hct-116 cells. This can be challenging as the two samples may have slightly shifted peaks centers at a given genomic region, leading to false positive differential peak calls. To handle this, Pycallingcards first combines the insertions from the two samples and calls peaks on the joint dataset. We do this using bedtools and pybedtools.
[22]:
import pybedtools
peak = cc.rd.combine_qbed([peak_data_HCT116, peak_data_K562])
peak = pybedtools.BedTool.from_dataframe(peak).merge().to_dataframe()
peak_data = peak.rename(columns={"chrom":"Chr", "start":"Start", "end":"End"})
peak_data
[22]:
| Chr | Start | End | |
|---|---|---|---|
| 0 | chr1 | 29684 | 30087 |
| 1 | chr1 | 36239 | 38107 |
| 2 | chr1 | 198893 | 201208 |
| 3 | chr1 | 203351 | 207161 |
| 4 | chr1 | 265549 | 266336 |
| ... | ... | ... | ... |
| 10445 | chrY | 15158250 | 15158653 |
| 10446 | chrY | 16985442 | 16985845 |
| 10447 | chrY | 19753311 | 19753714 |
| 10448 | chrY | 21011133 | 21011828 |
| 10449 | chrY | 56952574 | 56957328 |
10450 rows × 3 columns
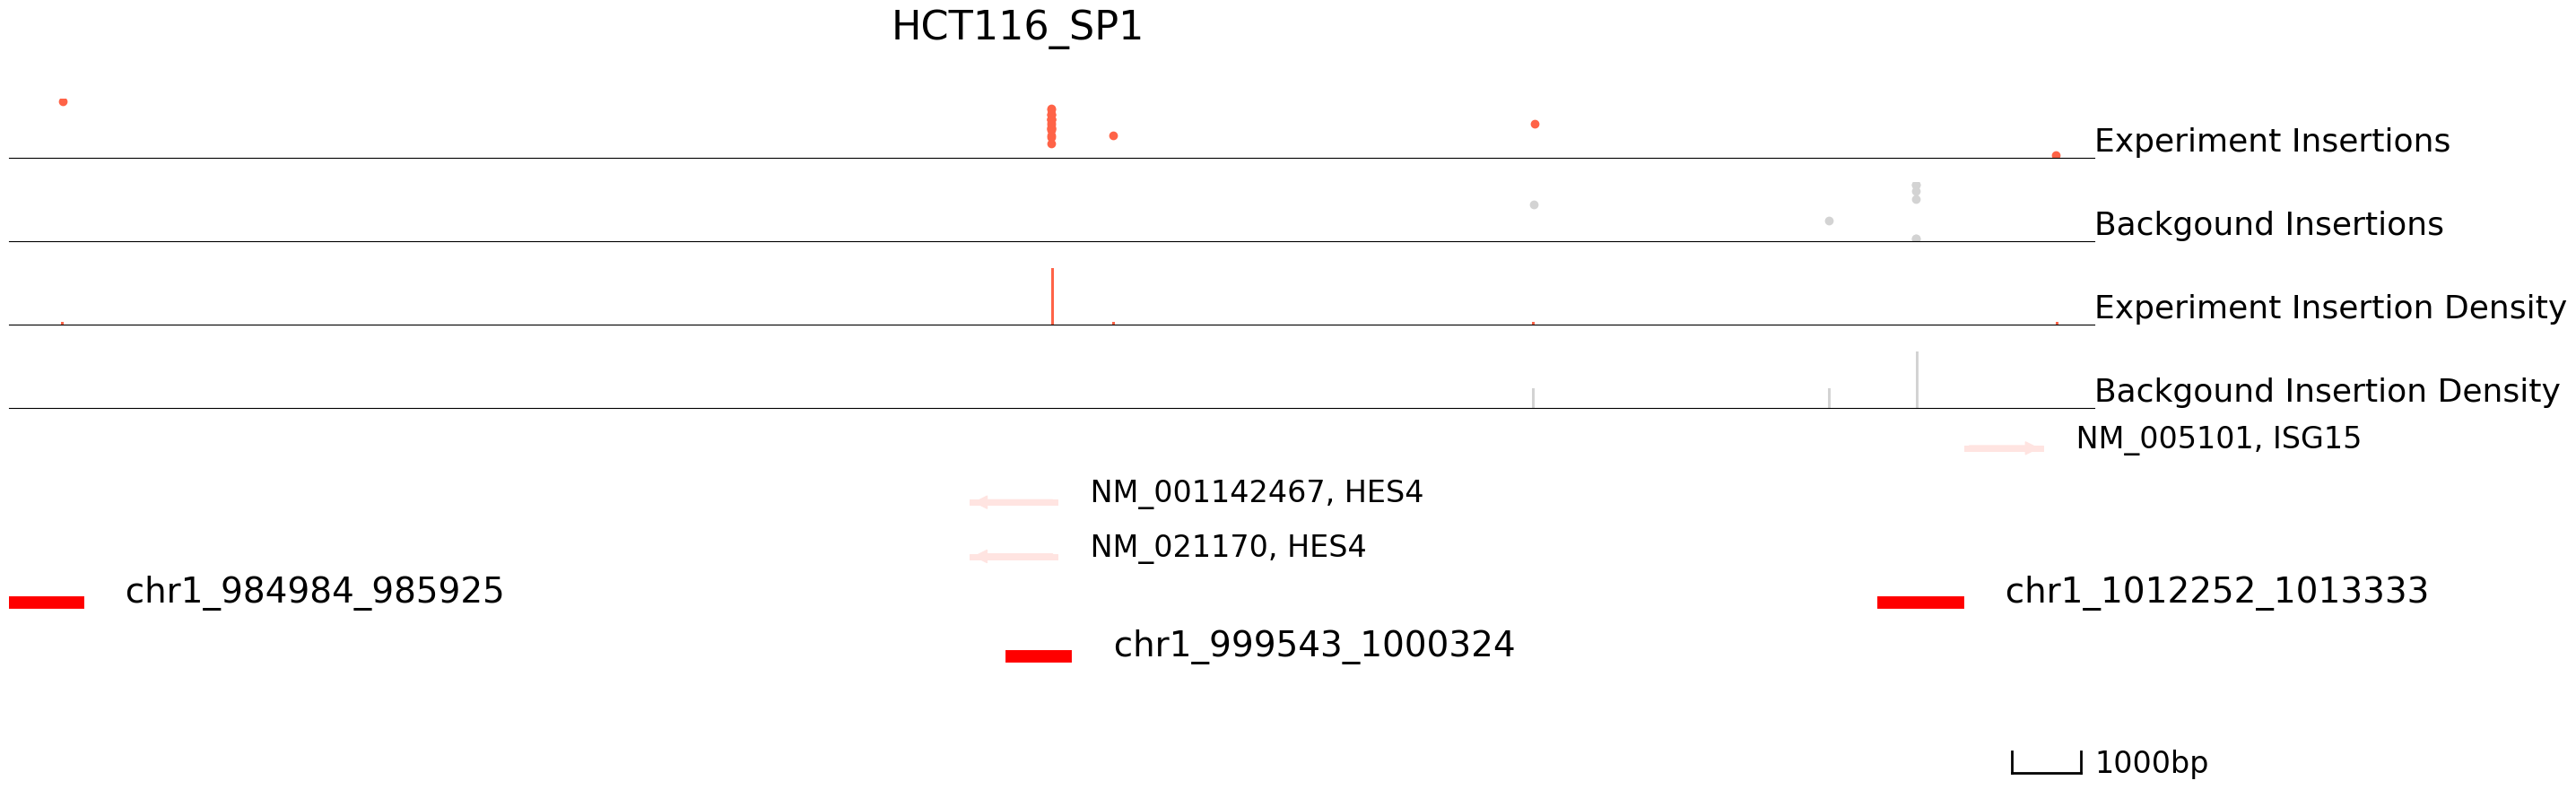
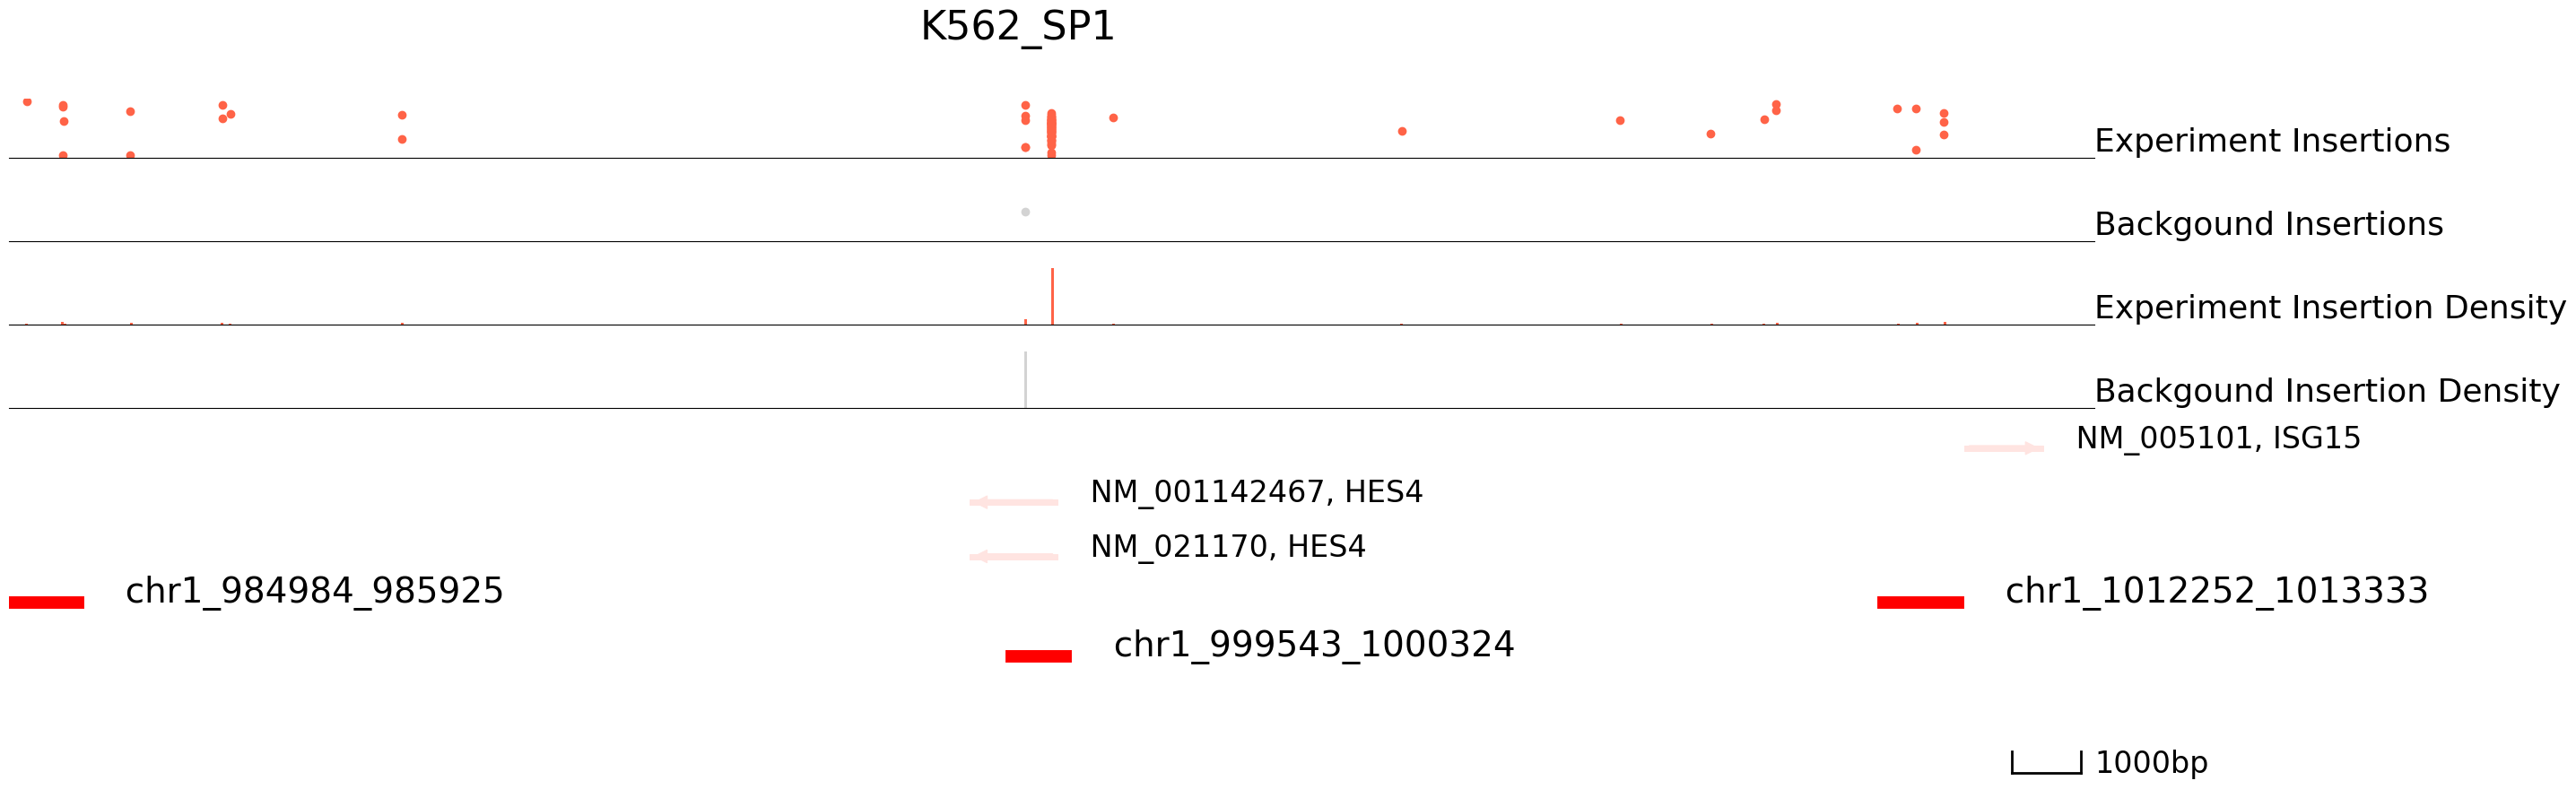
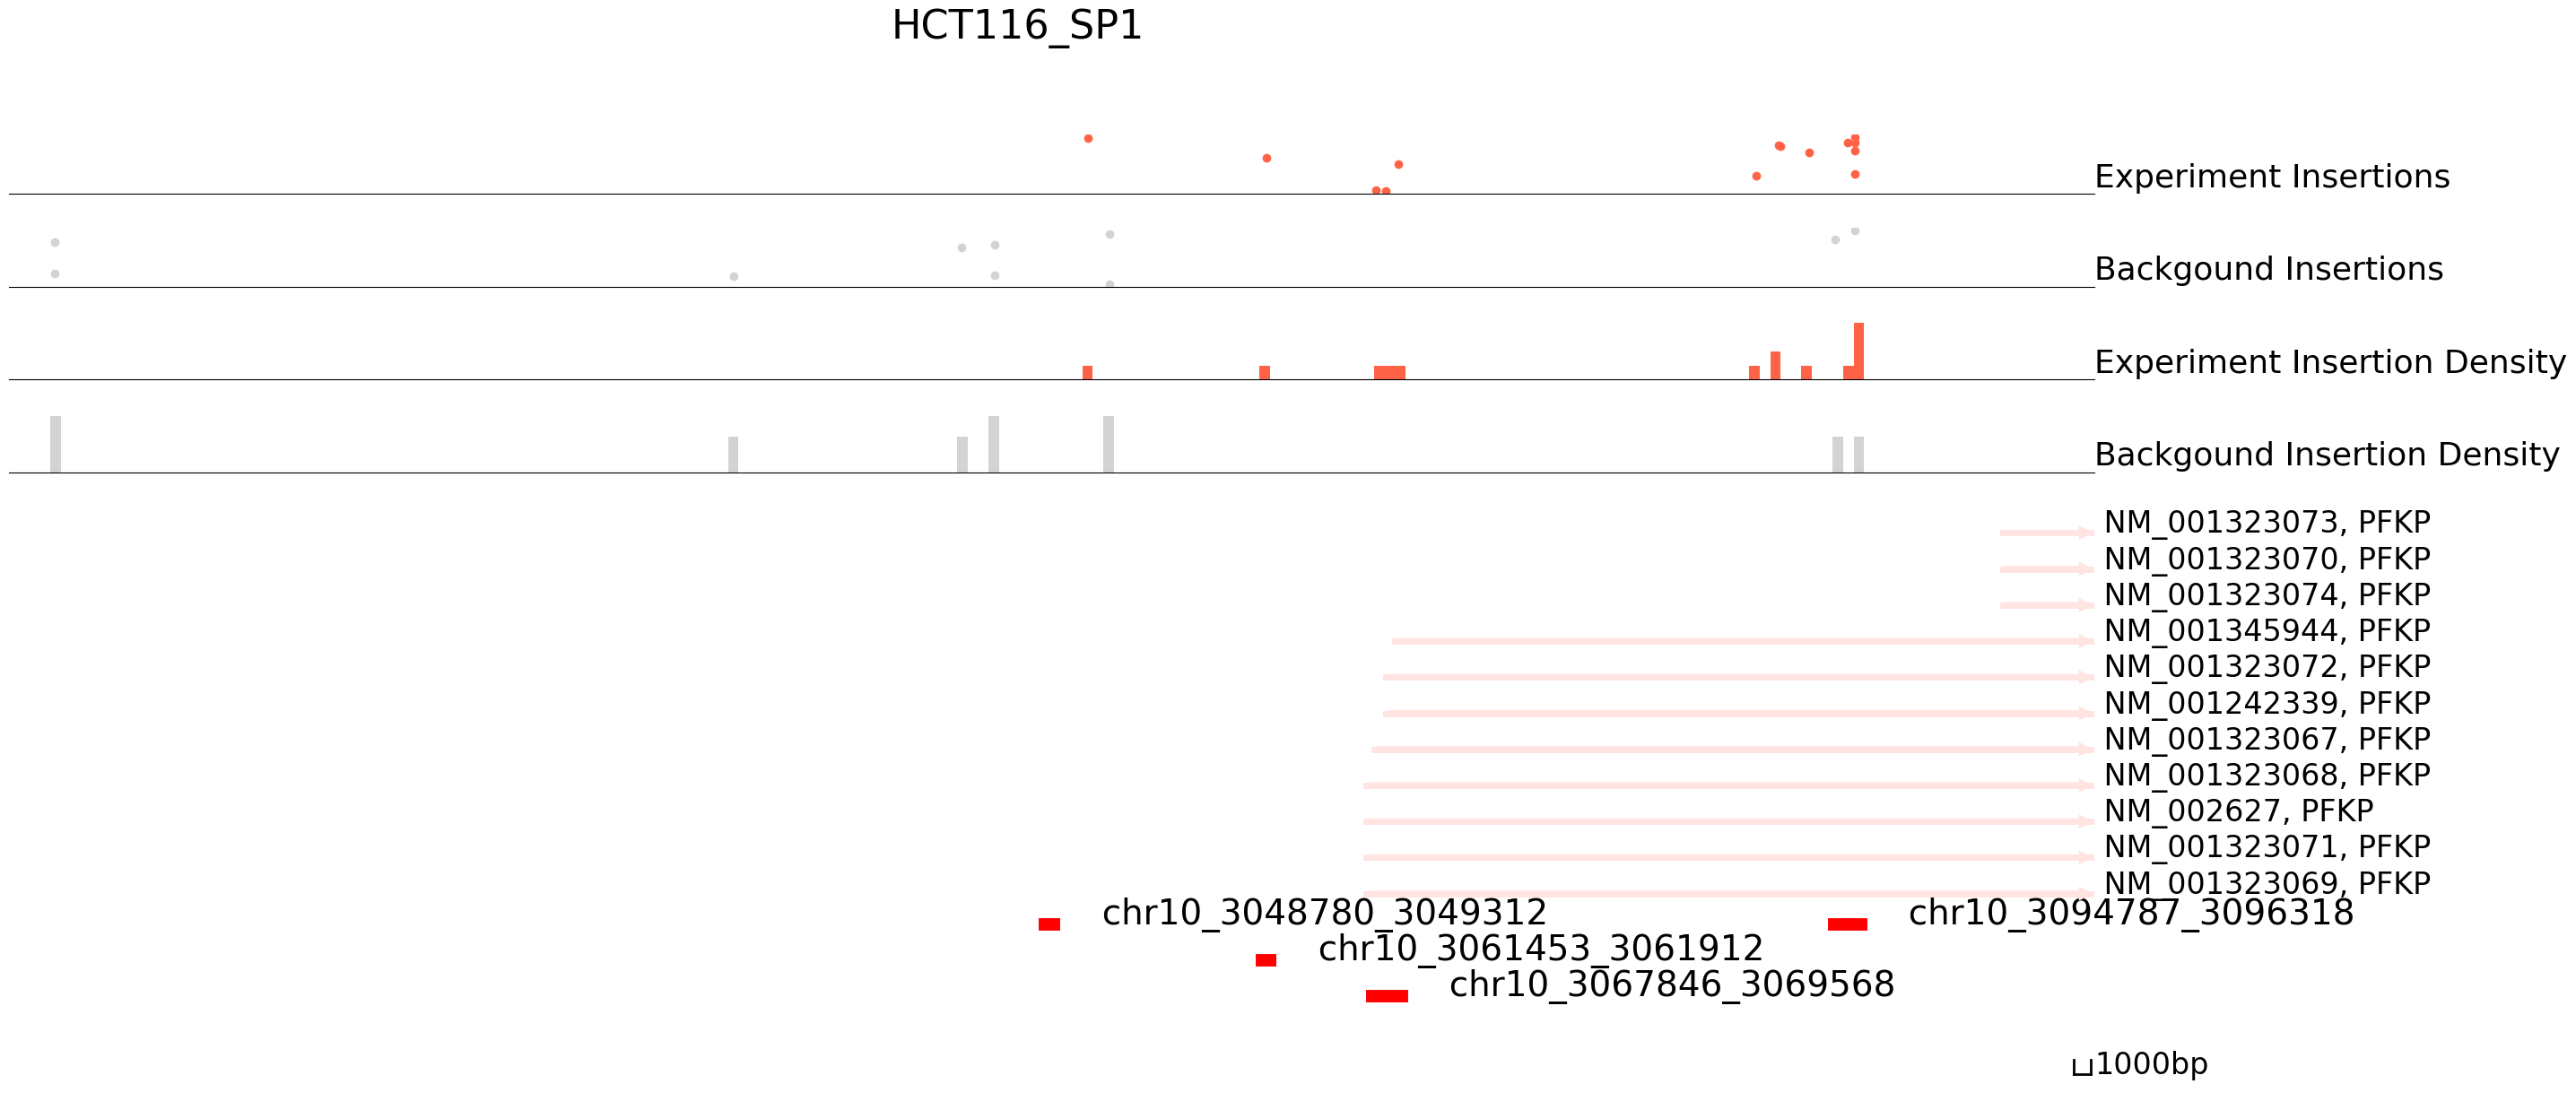
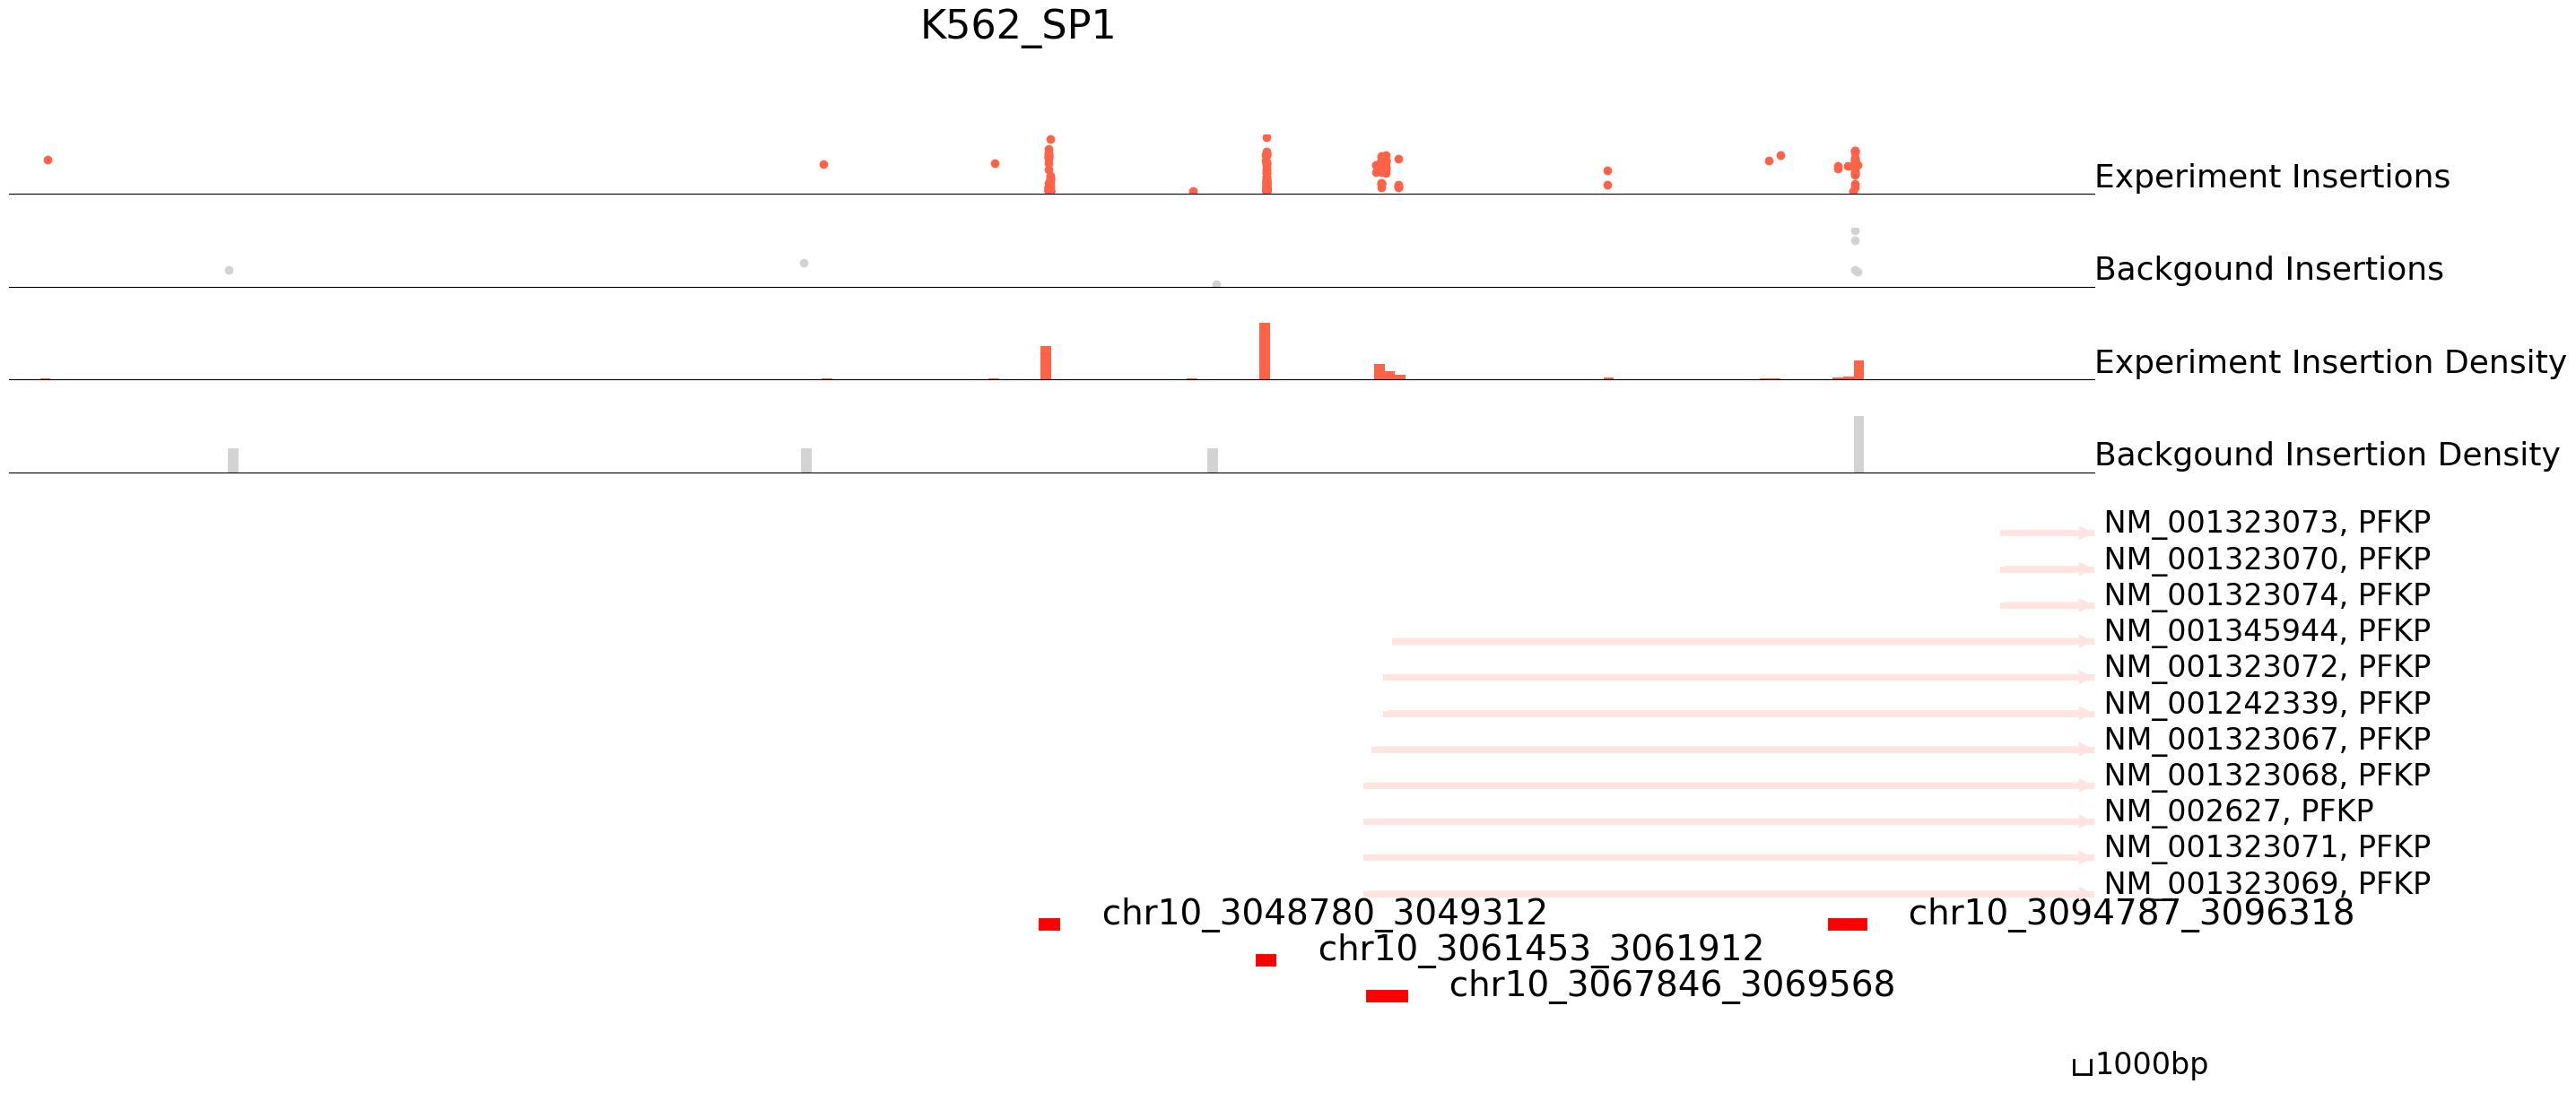
We can now visualize the peaks called on the joint dataset.
[23]:
cc.pl.draw_area("chr1",999921,1000324,15000,peak_data, HCT116_SP1, "hg38", HCT116_brd4, font_size=2,
                figsize = (30,10),peak_line = 2,save = False,plotsize = [1,1,3], example_length = 1000,
                title = "HCT116_SP1")
cc.pl.draw_area("chr1",999921,1000324,15000,peak_data, K562_SP1, "hg38", K562_brd4, font_size=2,
                figsize = (30,10),peak_line = 2,save = False,plotsize = [1,1,3], example_length = 1000,
                title = "K562_SP1")
[24]:
cc.pl.draw_area("chr10",3048452,3049913,60000,peak_data, HCT116_SP1, "hg38", HCT116_brd4, font_size=2,
                figsize = (30,14), peak_line = 3,save = False, bins = 200, plotsize = [1,1,5],
                example_length = 1000, title = "HCT116_SP1")
cc.pl.draw_area("chr10",3048452,3049913,60000,peak_data, K562_SP1, "hg38", K562_brd4, font_size=2,
                figsize = (30,14), peak_line = 3,save = False, bins = 200, plotsize = [1,1,5],
                example_length = 1000, title = "K562_SP1")
The results seem to be good! Congratulations! Now we can annotate the peaks using bedtools.
[25]:
peak_annotation = cc.pp.annotation(peak_data, reference = "hg38")
peak_annotation = cc.pp.combine_annotation(peak_data,peak_annotation)
peak_annotation
In the bedtools method, we would use bedtools in the default path. Set bedtools path by 'bedtools_path' if needed.
[25]:
| Chr | Start | End | Nearest Refseq1 | Gene Name1 | Direction1 | Distance1 | Nearest Refseq2 | Gene Name2 | Direction2 | Distance2 | |
|---|---|---|---|---|---|---|---|---|---|---|---|
| 0 | chr1 | 29684 | 30087 | NR_036051 | MIR1302-2 | + | 279 | NR_024540 | WASH7P | - | -315 |
| 1 | chr1 | 36239 | 38107 | NR_026818 | FAM138A | - | -159 | NR_036051 | MIR1302-2 | + | -5737 |
| 2 | chr1 | 198893 | 201208 | NR_026823 | FAM138D | - | 3921 | NR_107063 | MIR6859-3 | - | -10936 |
| 3 | chr1 | 203351 | 207161 | NR_026823 | FAM138D | - | 0 | NR_107063 | MIR6859-3 | - | -15394 |
| 4 | chr1 | 265549 | 266336 | NR_026823 | FAM138D | - | -58953 | NR_107063 | MIR6859-3 | - | -77592 |
| ... | ... | ... | ... | ... | ... | ... | ... | ... | ... | ... | ... |
| 10445 | chrY | 15158250 | 15158653 | NM_001206850 | NLGN4Y | + | -314283 | NR_046504 | NLGN4Y-AS1 | - | -354218 |
| 10446 | chrY | 16985442 | 16985845 | NR_028083 | FAM41AY1 | + | 515113 | NR_002160 | FAM224B | - | 589316 |
| 10447 | chrY | 19753311 | 19753714 | NM_001146706 | KDM5D | - | -8373 | NR_045128 | TXLNGY | + | -146142 |
| 10448 | chrY | 21011133 | 21011828 | NM_001039567 | RPS4Y2 | + | -230102 | NM_001282471 | PRORY | - | 371146 |
| 10449 | chrY | 56952574 | 56957328 | NM_005840 | SPRY3 | + | 0 | NM_001145149 | VAMP7 | + | 110472 |
10450 rows × 11 columns
Combine the two experiment qbed files to make anndata object.
[26]:
exp_qbed = pd.concat([K562_SP1,HCT116_SP1])
exp_qbed
[26]:
| Chr | Start | End | Reads | Direction | Barcodes | |
|---|---|---|---|---|---|---|
| 0 | chr1 | 16529 | 16533 | 163 | - | GCTCCTAAGTACGTTC-1 |
| 1 | chr1 | 29884 | 29888 | 10 | + | CTCACACCAGACGCTC-1 |
| 2 | chr1 | 29884 | 29888 | 155 | + | TGGCCAGCACCCATTC-1 |
| 3 | chr1 | 29884 | 29888 | 285 | + | GTGGGTCCACGGCCAT-1 |
| 4 | chr1 | 29884 | 29888 | 7 | + | CGTCTACTCAACACGT-1 |
| ... | ... | ... | ... | ... | ... | ... |
| 77205 | chrY | 25518788 | 25518792 | 2 | + | TGGGCGTTCGAACGGA-1 |
| 77206 | chrY | 56987633 | 56987637 | 13 | + | CAGTCCTAGGCACATG-1 |
| 77207 | chrY | 57080855 | 57080859 | 17 | + | CGGAGCTCATCGACGC-1 |
| 77208 | chrY | 57080855 | 57080859 | 7 | + | GTAACGTAGTTACGGG-1 |
| 77209 | chrY | 57080855 | 57080859 | 9 | + | TCAGCAAGTTGAACTC-1 |
404675 rows × 6 columns
Read the barcode file.
[27]:
barcodes = cc.datasets.SP1_K562HCT116_data(data = "barcodes")
barcodes = barcodes.drop_duplicates(subset=['Index'])
barcodes
[27]:
| Index | cluster | |
|---|---|---|
| 0 | AAACCTGAGAAAGTGG-1 | HCT116 |
| 1 | AAACCTGAGACCGGAT-1 | K562 |
| 2 | AAACCTGAGACTAGAT-1 | HCT116 |
| 3 | AAACCTGAGAGCTTCT-1 | HCT116 |
| 4 | AAACCTGAGAGTACCG-1 | HCT116 |
| ... | ... | ... |
| 52206 | TTTGTCATCTCCGGTT-1 | K562 |
| 52207 | TTTGTCATCTCGATGA-1 | K562 |
| 52208 | TTTGTCATCTCTAAGG-1 | K562 |
| 52209 | TTTGTCATCTGGAGCC-1 | HCT116 |
| 52210 | TTTGTCATCTTGGGTA-1 | HCT116 |
51079 rows × 2 columns
Now we will connect the peaks (and insertions under the peaks) to the cell barcode data. To do so, we will use the qbed data, peak data and barcodes data to make a cell by peak anndata object.
[28]:
adata_cc = cc.pp.make_Anndata(exp_qbed, peak_annotation, barcodes)
adata_cc
100%|██████████| 24/24 [00:02<00:00, 10.77it/s]
[28]:
AnnData object with n_obs × n_vars = 51079 × 10450
    obs: 'cluster'
    var: 'Chr', 'Start', 'End', 'Nearest Refseq1', 'Gene Name1', 'Direction1', 'Distance1', 'Nearest Refseq2', 'Gene Name2', 'Direction2', 'Distance2'
Although one peak should have many insertions, there is a chance that all the cells from the peak were filtered by the RNA preprocesssing. In this case, we advise to filter the peaks. Additionally, we also recommend to filter cells that have very few insertions.
[29]:
cc.pp.filter_peaks(adata_cc, min_counts = 5)
cc.pp.filter_peaks(adata_cc, min_cells = 5)
adata_cc
[29]:
AnnData object with n_obs × n_vars = 51079 × 10448
    obs: 'cluster'
    var: 'Chr', 'Start', 'End', 'Nearest Refseq1', 'Gene Name1', 'Direction1', 'Distance1', 'Nearest Refseq2', 'Gene Name2', 'Direction2', 'Distance2', 'n_counts', 'n_cells'
Next we can perform differential peak analysis to determine which peaks are cell type specific. In this example, we use the fisher exact test to find peaks enriched in K562 versus Hct116 cells.
[30]:
cc.tl.rank_peak_groups(adata_cc, "cluster", method = 'fisher_exact', key_added = 'fisher_exact')
100%|██████████| 2/2 [00:55<00:00, 27.99s/it]
We can plot the results for differential peak analysis.
[31]:
cc.pl.rank_peak_groups(adata_cc, key = 'fisher_exact')
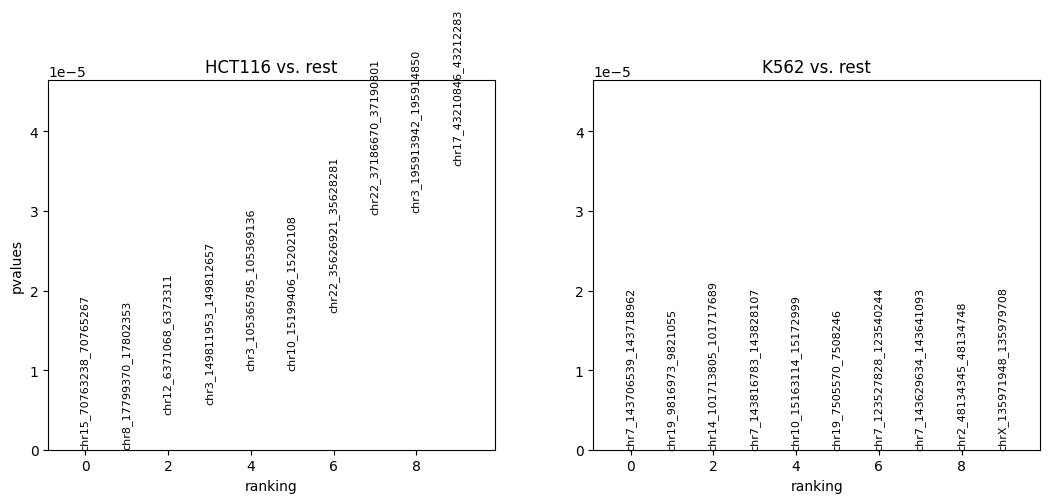
Now let’s visualize some peaks that are differentially bound. The colored ones are the insertions for the cluster of interest (i.e. cell type) and the grey ones are insertions in the rest of the clusters. In this case there are only two clusters, HCT116 and K562. We observe large differences in Sp1 binding in HCT116 and K562 cells.
[32]:
bg_qbed = pd.concat([K562_brd4, HCT116_brd4])
bg_qbed
[32]:
| Chr | Start | End | Reads | Direction | Barcodes | |
|---|---|---|---|---|---|---|
| 0 | chr1 | 30238 | 30242 | 3 | + | TTTACTGCATAAAGGT-1 |
| 1 | chr1 | 30355 | 30359 | 2 | - | ATCACGAAGAGTAATC-1 |
| 2 | chr1 | 30355 | 30359 | 70 | + | TTGAACGCAAATCCGT-1 |
| 3 | chr1 | 31101 | 31105 | 2 | + | CCTCAGTCATCAGTAC-1 |
| 4 | chr1 | 32116 | 32120 | 5 | + | CTAGTGAAGACAAAGG-1 |
| ... | ... | ... | ... | ... | ... | ... |
| 37769 | chrY | 18037315 | 18037319 | 9 | - | GCAGTTAAGATCTGAA-1 |
| 37770 | chrY | 24036504 | 24036508 | 168 | + | GCAGTTAAGATCTGAA-1 |
| 37771 | chrY | 24036504 | 24036508 | 508 | + | CATATGGCAGCCAGAA-1 |
| 37772 | chrY | 25633622 | 25633626 | 13 | - | GCAGTTAAGATCTGAA-1 |
| 37773 | chrY | 25633622 | 25633626 | 32 | - | CATATGGCAGCCAGAA-1 |
145159 rows × 6 columns
In the tracks above, we see a strong peak on Chr 15 in HCT116 cell (purple) that is not present in K562 cells (red)
[33]:
cc.pl.draw_area("chr7", 143706539, 143718962, 100000, peak_data, exp_qbed, "hg38", adata = adata_cc,
                bins = 250, font_size=2, name = "K562", key = 'cluster', figsize = (30,13),
                name_insertion2 = 'Total Insertions', name_density2 = 'Total Insertion Density',
                name_insertion1 = 'K562 Insertions', name_density1 = 'K562 Insertion Density',
                peak_line = 4, color = "red", plotsize = [1,1,5], title = "chr7_143706539_143718962_K562")
cc.pl.draw_area("chr7",143706539,143718962,100000,peak_data,exp_qbed,"hg38",adata = adata_cc,
                bins = 250, font_size=2, name = "HCT116", key ='cluster', figsize = (30,13),
                name_insertion2 = 'Total Insertions', name_density2 = 'Total Insertion Density',
                name_insertion1 = 'HCT116 Insertions', name_density1 = 'HCT116 Insertion Density',
                peak_line = 4, color = "purple", plotsize = [1,1,5], title = "chr7_143706539_143718962_HCT116")
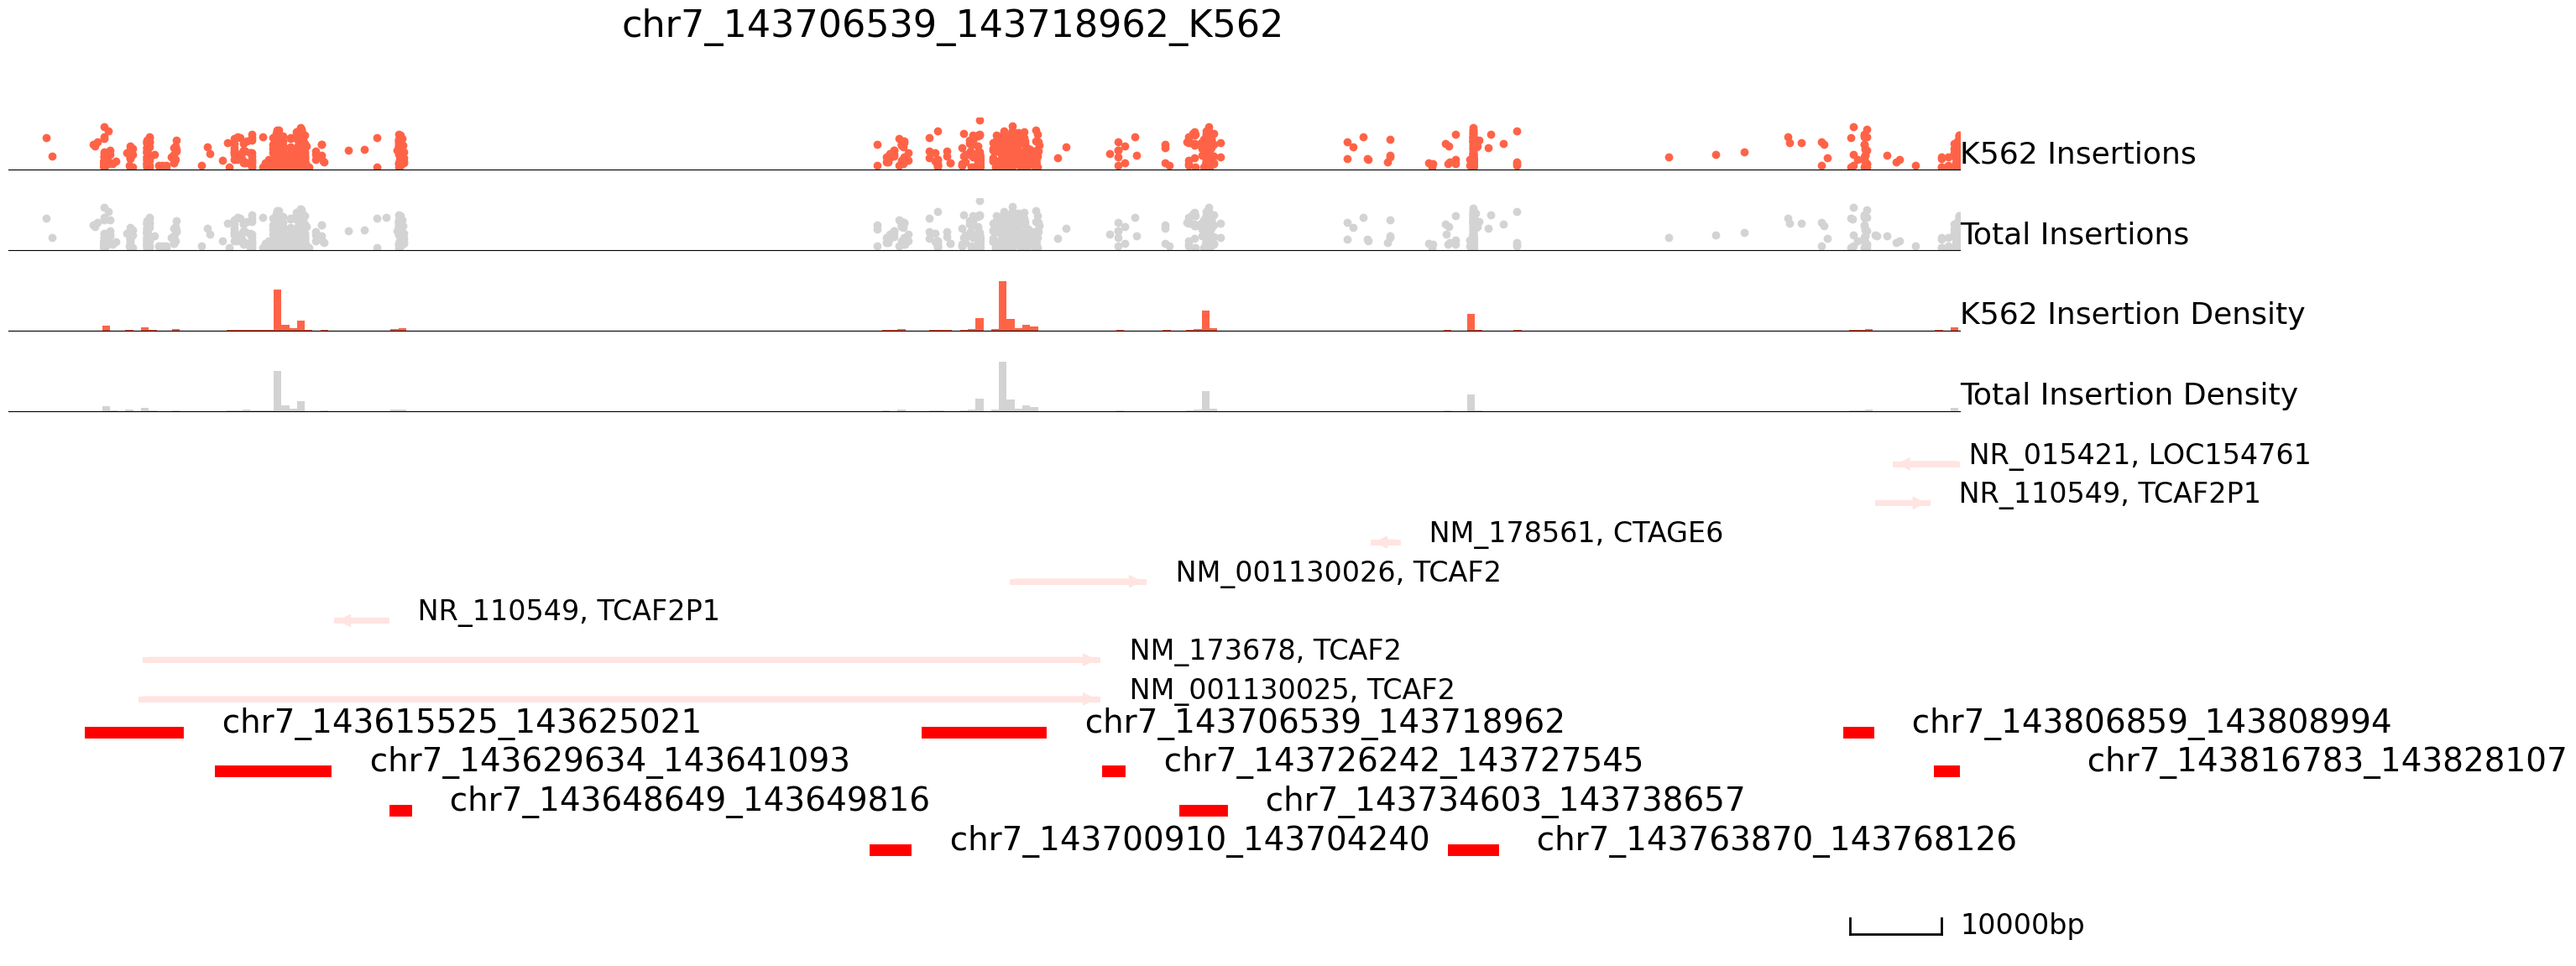
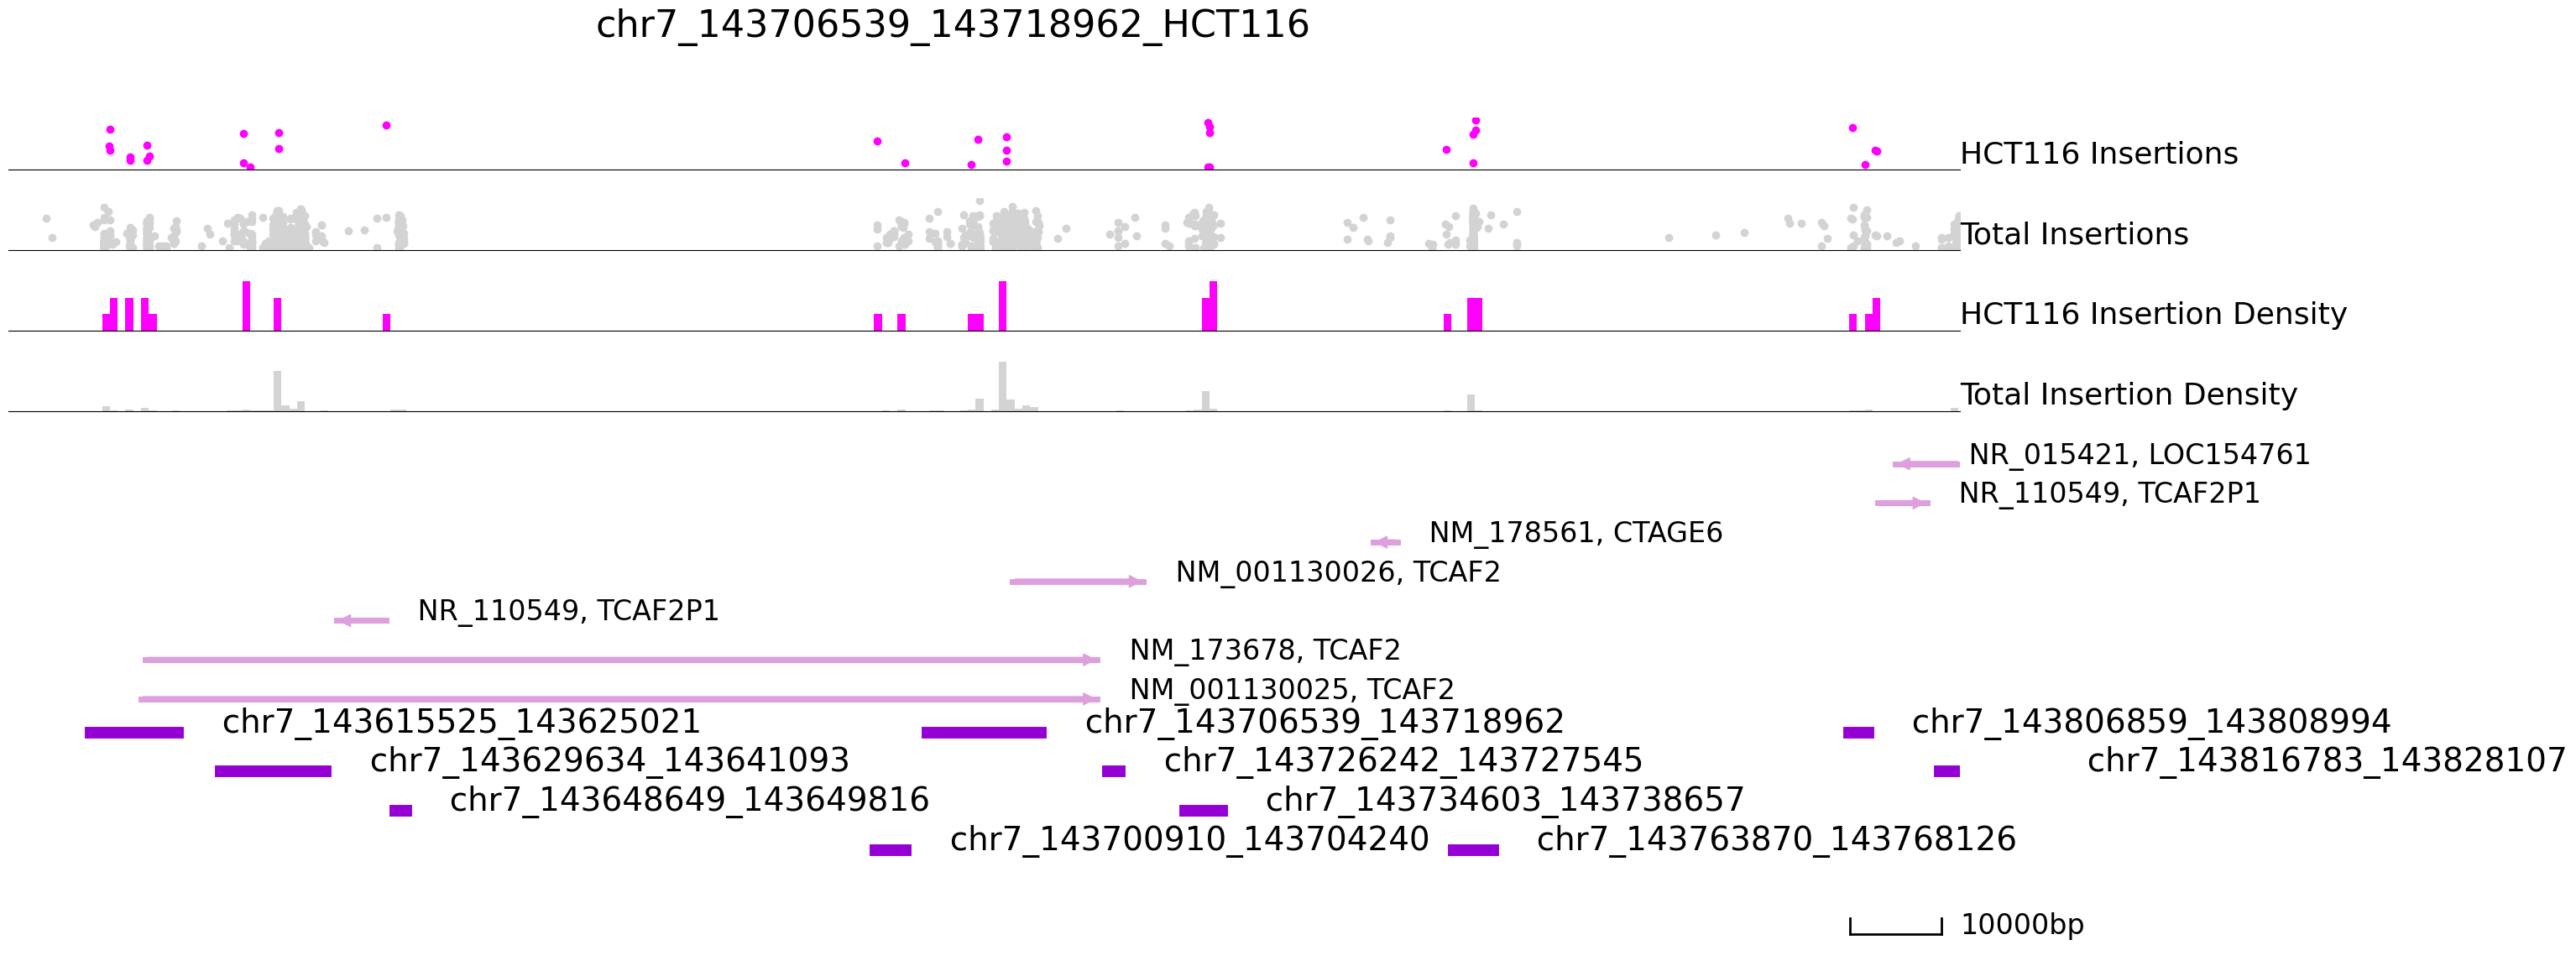
In the tracks above we see a number of Sp1 peaks on chr7 that are tightly bound in K562, but not in HCT116.
[34]:
cc.pl.draw_area("chr8", 17799370, 17802353, 100000, peak_data, exp_qbed, "hg38", adata = adata_cc,
                bins = 250, font_size=2, name = "K562", key = 'cluster', figsize = (30,13), peak_line = 3,
                name_insertion2 = 'Total Insertions', name_density2 = 'Total Insertion Density',
                name_insertion1 = 'K562 Insertions', name_density1 = 'K562 Insertion Density',
                color = "red", plotsize = [1,1,6], title = "chr19_9818643_9820060")
cc.pl.draw_area("chr8", 17799370, 17802353, 100000, peak_data, exp_qbed, "hg38", adata = adata_cc,
                bins = 250, font_size=2, name = "HCT116",key ='cluster',figsize = (30,13),peak_line = 3,
                name_insertion2 = 'Total Insertions', name_density2 = 'Total Insertion Density',
                name_insertion1 = 'HCT116 Insertions', name_density1 = 'HCT116 Insertion Density',
                color = "purple", plotsize = [1,1,6], title = "chr19_9818643_9820060")
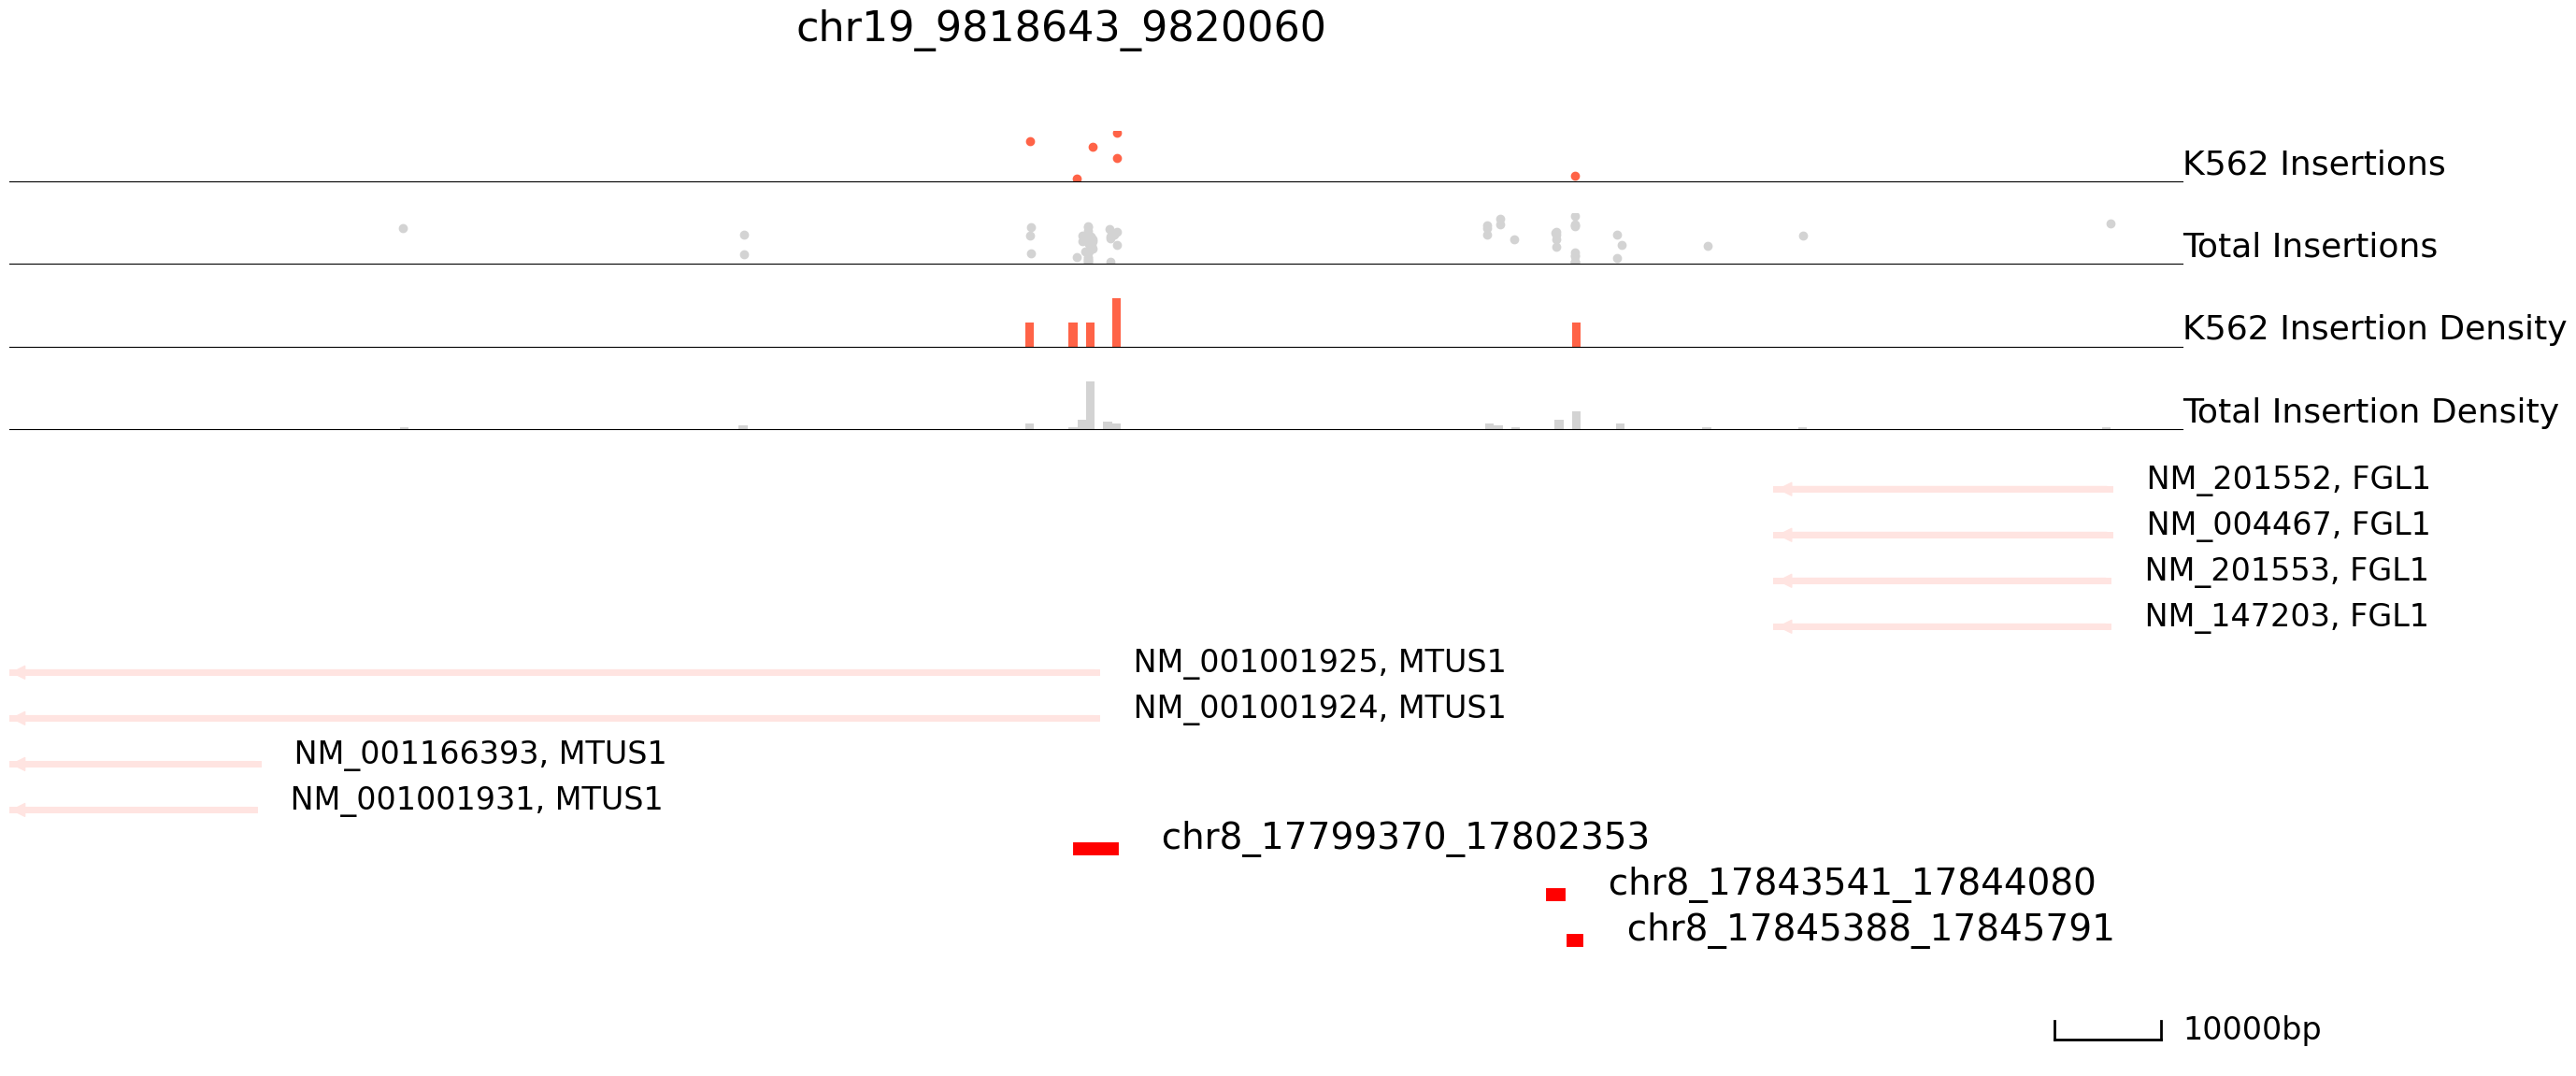
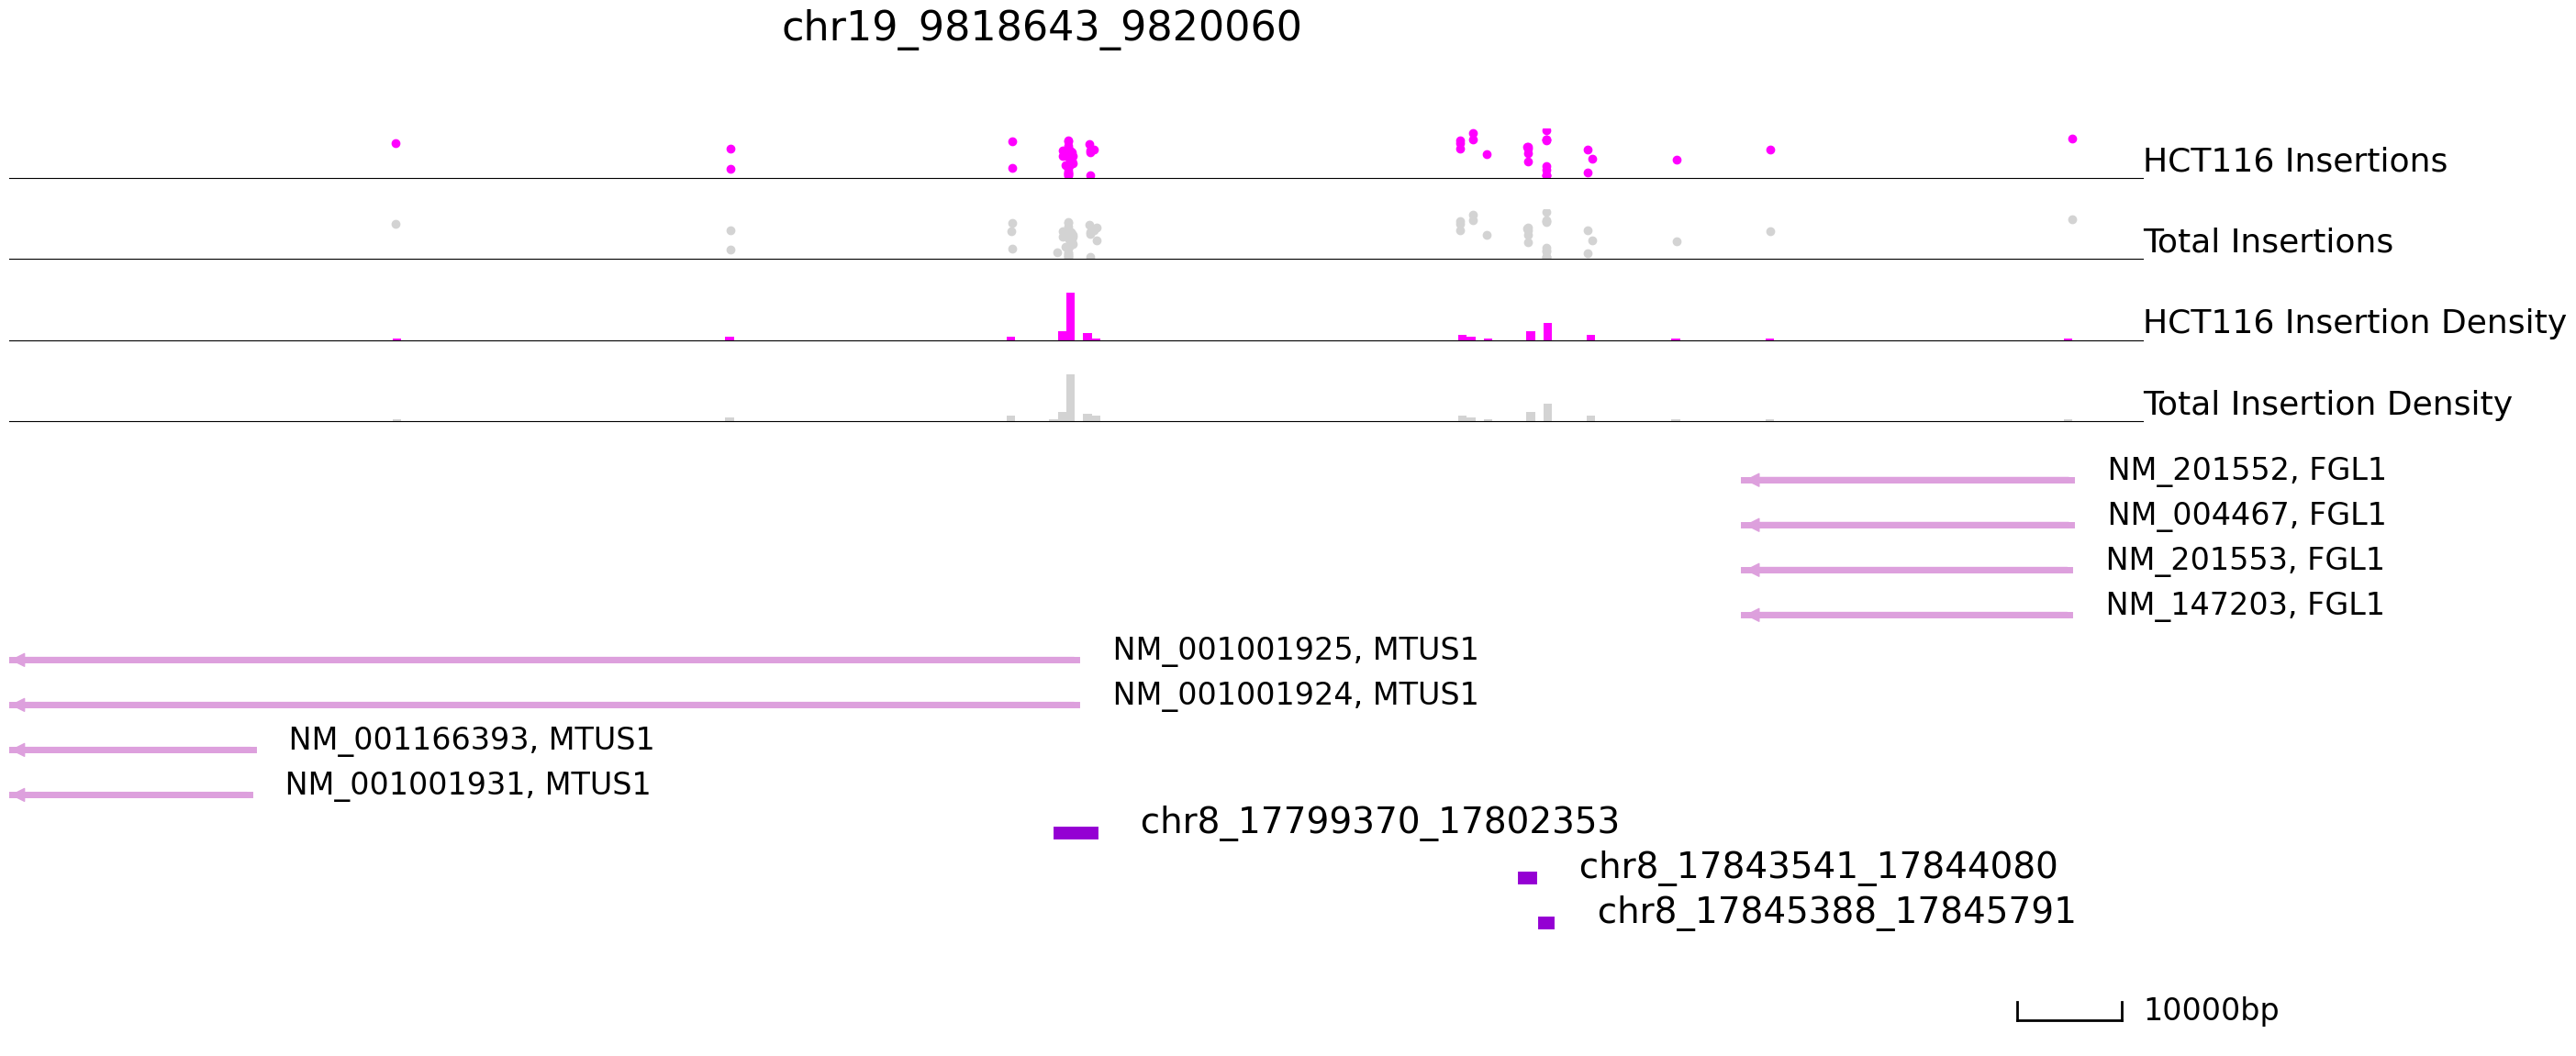
Here we find peaks on Chr8 that are bound in HCT116 but not in K562 cells.
Saved the file if needed.
[35]:
adata_cc.write("SP1_qbed.h5ad")