Tutorial: Yeast TYE7 bulk calling cards data
In this tutorial, we analyze a calling card experiment that mapped the binding of the yeast transcription factor TYE7. The dataset is from Shively CA, PNAS. (2020) and can be downloaded from GEO. One of the main findings of that paper was that Tye7p cooperatively binds with the transcription factor Gcr2p. Here we will analyze Tye7p binding in wild-type and gcr2 KO cells.
In this tutorial, we will call peaks, annotate them, and perform a differential peak analysis.
[1]:
import pycallingcards as cc
import numpy as np
import pandas as pd
import scanpy as sc
from matplotlib import pyplot as plt
plt.rcParams['figure.dpi'] = 150
We start by reading in a abed datafile. Because this data was published several years ago, the data is in the old format: one row is one insertion and columns indicate the chromosome, start point and read number. Thus, we first convert it to the new file format.
Use cc.rd.read_qbed(filename) to read your own qbed data.
[2]:
TYE7 = cc.rd.read_qbed("https://github.com/The-Mitra-Lab/pycallingcards_data/releases/download/data/GSM3946397_TEF1p_TYE7_ALL.gnashy.txt")
TYE7
[2]:
| Chr | Start | End | Reads | Direction | Barcodes | |
|---|---|---|---|---|---|---|
| 0 | 1 | 1501 | 111 | NaN | NaN | NaN |
| 1 | 1 | 1502 | 1 | NaN | NaN | NaN |
| 2 | 1 | 5320 | 1 | NaN | NaN | NaN |
| 3 | 1 | 5544 | 199 | NaN | NaN | NaN |
| 4 | 1 | 32962 | 1 | NaN | NaN | NaN |
| ... | ... | ... | ... | ... | ... | ... |
| 11450 | 16 | 928369 | 1 | NaN | NaN | NaN |
| 11451 | 16 | 928381 | 14 | NaN | NaN | NaN |
| 11452 | 16 | 928555 | 34 | NaN | NaN | NaN |
| 11453 | 16 | 930647 | 330 | NaN | NaN | NaN |
| 11454 | 16 | 939536 | 22 | NaN | NaN | NaN |
11455 rows × 6 columns
[3]:
TYE7_gcr2ko = cc.rd.read_qbed("https://github.com/The-Mitra-Lab/pycallingcards_data/releases/download/data/GSM3946398_TEF1p_TYE7_gcr2ko_ALL.gnashy.txt")
TYE7_gcr2ko
[3]:
| Chr | Start | End | Reads | Direction | Barcodes | |
|---|---|---|---|---|---|---|
| 0 | 1 | 3108 | 1 | NaN | NaN | NaN |
| 1 | 1 | 8064 | 9 | NaN | NaN | NaN |
| 2 | 1 | 30957 | 2 | NaN | NaN | NaN |
| 3 | 1 | 30989 | 1 | NaN | NaN | NaN |
| 4 | 1 | 31530 | 1 | NaN | NaN | NaN |
| ... | ... | ... | ... | ... | ... | ... |
| 12283 | 16 | 930468 | 2 | NaN | NaN | NaN |
| 12284 | 16 | 930698 | 13 | NaN | NaN | NaN |
| 12285 | 16 | 936191 | 4 | NaN | NaN | NaN |
| 12286 | 16 | 938479 | 3 | NaN | NaN | NaN |
| 12287 | 16 | 941830 | 116 | NaN | NaN | NaN |
12288 rows × 6 columns
Define a function to transfer data to new version.
[4]:
def transfer(data):
    for i in range(len(data)):
        data.iloc[i,3] = data.iloc[i,2]
        data.iloc[i,2] = data.iloc[i,1] + 1
        num = data.iloc[i,0]
        if num == 1:
            data.iloc[i,0] = 'chrI'
        elif num == 2:
            data.iloc[i,0] = 'chrII'
        elif num == 3:
            data.iloc[i,0] = 'chrIII'
        elif num == 4:
            data.iloc[i,0] = 'chrIV'
        elif num == 5:
            data.iloc[i,0] = 'chrV'
        elif num == 6:
            data.iloc[i,0] = 'chrVI'
        elif num == 7:
            data.iloc[i,0] = 'chrVII'
        elif num == 8:
            data.iloc[i,0] = 'chrVIII'
        elif num == 9:
            data.iloc[i,0] = 'chrIX'
        elif num == 10:
            data.iloc[i,0] = 'chrX'
        elif num == 11:
            data.iloc[i,0] = 'chrXI'
        elif num == 12:
            data.iloc[i,0] = 'chrXII'
        elif num == 13:
            data.iloc[i,0] = 'chrXIII'
        elif num == 14:
            data.iloc[i,0] = 'chrXIV'
        elif num == 15:
            data.iloc[i,0] = 'chrXV'
        elif num == 16:
            data.iloc[i,0] = 'chrXVI'
    return data
[5]:
TYE7 = transfer(TYE7)
TYE7['group'] = 'TYE7'
TYE7
[5]:
| Chr | Start | End | Reads | Direction | Barcodes | group | |
|---|---|---|---|---|---|---|---|
| 0 | chrI | 1501 | 1502 | 111.0 | NaN | NaN | TYE7 |
| 1 | chrI | 1502 | 1503 | 1.0 | NaN | NaN | TYE7 |
| 2 | chrI | 5320 | 5321 | 1.0 | NaN | NaN | TYE7 |
| 3 | chrI | 5544 | 5545 | 199.0 | NaN | NaN | TYE7 |
| 4 | chrI | 32962 | 32963 | 1.0 | NaN | NaN | TYE7 |
| ... | ... | ... | ... | ... | ... | ... | ... |
| 11450 | chrXVI | 928369 | 928370 | 1.0 | NaN | NaN | TYE7 |
| 11451 | chrXVI | 928381 | 928382 | 14.0 | NaN | NaN | TYE7 |
| 11452 | chrXVI | 928555 | 928556 | 34.0 | NaN | NaN | TYE7 |
| 11453 | chrXVI | 930647 | 930648 | 330.0 | NaN | NaN | TYE7 |
| 11454 | chrXVI | 939536 | 939537 | 22.0 | NaN | NaN | TYE7 |
11455 rows × 7 columns
[6]:
TYE7_gcr2ko = transfer(TYE7_gcr2ko)
TYE7_gcr2ko['group'] = 'TYE7_gcr2ko'
TYE7_gcr2ko
[6]:
| Chr | Start | End | Reads | Direction | Barcodes | group | |
|---|---|---|---|---|---|---|---|
| 0 | chrI | 3108 | 3109 | 1.0 | NaN | NaN | TYE7_gcr2ko |
| 1 | chrI | 8064 | 8065 | 9.0 | NaN | NaN | TYE7_gcr2ko |
| 2 | chrI | 30957 | 30958 | 2.0 | NaN | NaN | TYE7_gcr2ko |
| 3 | chrI | 30989 | 30990 | 1.0 | NaN | NaN | TYE7_gcr2ko |
| 4 | chrI | 31530 | 31531 | 1.0 | NaN | NaN | TYE7_gcr2ko |
| ... | ... | ... | ... | ... | ... | ... | ... |
| 12283 | chrXVI | 930468 | 930469 | 2.0 | NaN | NaN | TYE7_gcr2ko |
| 12284 | chrXVI | 930698 | 930699 | 13.0 | NaN | NaN | TYE7_gcr2ko |
| 12285 | chrXVI | 936191 | 936192 | 4.0 | NaN | NaN | TYE7_gcr2ko |
| 12286 | chrXVI | 938479 | 938480 | 3.0 | NaN | NaN | TYE7_gcr2ko |
| 12287 | chrXVI | 941830 | 941831 | 116.0 | NaN | NaN | TYE7_gcr2ko |
12288 rows × 7 columns
In order to call differential peaks, we conbine two qbed files together.
[7]:
qbed_data = cc.rd.combine_qbed([TYE7, TYE7_gcr2ko])
qbed_data
[7]:
| Chr | Start | End | Reads | Direction | Barcodes | group | |
|---|---|---|---|---|---|---|---|
| 0 | chrI | 1501 | 1502 | 111.0 | NaN | NaN | TYE7 |
| 1 | chrI | 1502 | 1503 | 1.0 | NaN | NaN | TYE7 |
| 2 | chrI | 1557 | 1558 | 304.0 | NaN | NaN | TYE7_gcr2ko |
| 3 | chrI | 1687 | 1688 | 8.0 | NaN | NaN | TYE7_gcr2ko |
| 4 | chrI | 1690 | 1691 | 7.0 | NaN | NaN | TYE7_gcr2ko |
| ... | ... | ... | ... | ... | ... | ... | ... |
| 23738 | chrXVI | 939075 | 939076 | 120.0 | NaN | NaN | TYE7_gcr2ko |
| 23739 | chrXVI | 939536 | 939537 | 22.0 | NaN | NaN | TYE7 |
| 23740 | chrXVI | 940225 | 940226 | 1.0 | NaN | NaN | TYE7_gcr2ko |
| 23741 | chrXVI | 941830 | 941831 | 116.0 | NaN | NaN | TYE7_gcr2ko |
| 23742 | chrXVI | 943167 | 943168 | 170.0 | NaN | NaN | TYE7 |
23743 rows × 7 columns
Because insertions are discrete, we now need to call peaks to deduce potential binding sites. Three different methods (CCcaller, MACCs, Blockify) are available along with three different species (hg38, mm10, sacCer3).
Because of the particularity of yeast calling cards data, we use MACCs in yeast(‘sacCer3’) data. window_size is the most important parameter for MACCs, it is highly related to the length of a peak. 100-200 is a good fit for window_size. step_size is another important paramenter and it controls how careful we are at looking into the chromosomes. 30-100 is good for step_size. pvalue_cutoff is also an important parameter and numbers from 0.0001 to 0.01 are strongly advised. pseudocounts is advised to be 0.1-1.
[8]:
peak_data = cc.pp.call_peaks(qbed_data, method = "MACCs", reference = "sacCer3", extend = 50, window_size = 125,
                             step_size = 60, pvalue_cutoff = 0.0001, lam_win_size = None, pseudocounts = 1,
                             record = True, save = "peak.bed")
peak_data
For the MACCS method without background, [expdata, reference, pvalue_cutoff, lam_win_size, window_size, step_size, extend, pseudocounts, test_method, min_insertions, record] would be utilized.
100%|██████████| 16/16 [00:00<00:00, 19.97it/s]
[8]:
| Chr | Start | End | Center | pvalue | Experiment Insertions | Reference Insertions | Fraction Experiment | TPH Experiment | Expect insertions | pvalue_adj | |
|---|---|---|---|---|---|---|---|---|---|---|---|
| 0 | chrI | 68120 | 68335 | 68249.0 | 1.607677e-09 | 27 | 25 | 0.001137 | 1.137177e+05 | 7.429007 | 1.040712e-06 |
| 1 | chrI | 71058 | 71450 | 71268.0 | 0.000000e+00 | 57 | 27 | 0.002401 | 2.400708e+05 | 7.943327 | 0.000000e+00 |
| 2 | chrI | 229758 | 229966 | 229890.0 | 1.183165e-12 | 43 | 45 | 0.001811 | 1.811060e+05 | 12.572212 | 8.633875e-10 |
| 3 | chrII | 29937 | 30481 | 30158.5 | 0.000000e+00 | 71 | 0 | 0.002990 | 2.990355e+05 | 1.252814 | 0.000000e+00 |
| 4 | chrII | 221245 | 221577 | 221472.0 | 0.000000e+00 | 86 | 8 | 0.003622 | 3.622120e+05 | 3.022509 | 0.000000e+00 |
| ... | ... | ... | ... | ... | ... | ... | ... | ... | ... | ... | ... |
| 64 | chrXV | 987325 | 988055 | 987562.0 | 0.000000e+00 | 224 | 64 | 0.009434 | 9.434360e+05 | 20.135194 | 0.000000e+00 |
| 65 | chrXV | 988153 | 988367 | 988290.0 | 1.295000e-07 | 24 | 22 | 0.001011 | 1.010824e+05 | 7.577723 | 7.532581e-05 |
| 66 | chrXVI | 411349 | 411915 | 411592.0 | 0.000000e+00 | 110 | 34 | 0.004633 | 4.632944e+05 | 11.167010 | 0.000000e+00 |
| 67 | chrXVI | 412048 | 412354 | 412177.0 | 0.000000e+00 | 75 | 19 | 0.003159 | 3.158826e+05 | 6.681564 | 0.000000e+00 |
| 68 | chrXVI | 855654 | 856341 | 855836.0 | 0.000000e+00 | 623 | 12 | 0.026239 | 2.623931e+06 | 4.588356 | 0.000000e+00 |
69 rows × 11 columns
In order to choose the suitable method and parameters for peak calling, please take a look at genome areas. We stongly advise to adjust the parameters for cc.pp.call_peaks() to call better peaks.
In this plot, the colored ones are the experiment qbed data and the middle section is the distribution of insertions. The bottom section represents reference genes and peaks.
In yeast, one peak might be divided into two and the true binding site is in the middle space. Thus, please carefully modify the window_size and step_size parameters.
[9]:
cc.pl.draw_area("chrXVI", 860297, 861116, 8000, peak_data, qbed_data, "sacCer3", font_size=2,
                figsize = (30,8), peak_line = 1, save = False, plotsize = [1,1,5], example_length = 1000)
[10]:
cc.pl.draw_area("chrI", 68926, 67722, 6000, peak_data, qbed_data, "sacCer3", font_size=2,
                figsize = (30,6), peak_line = 1, save = False, plotsize = [1,1,4], example_length = 1000)
We can also visualize our data directly in the WashU Epigenome Browser. This can be useful for overlaying your data with other published datasets. Please note that this link only valid for 24hrs, so you will have to rerun it if you want to use it after this time period.
For bedgraph file, it is aimed to show the distribution of qbed data. Please set the the Aggregate method of bedgraph file to count or sum and fix the Y-axis if you want to compare several datasets.
[11]:
qbed= {"TYE7":TYE7, "TYE7_gcr2ko":TYE7_gcr2ko}
bed = {'PEAK':peak_data}
cc.pl.WashU_browser_url(qbed, bed, genome = 'sacCer3')
All qbed addressed
All bed addressed
Uploading files
Please click the following link to see the data on WashU Epigenome Browser directly.
https://epigenomegateway.wustl.edu/browser/?genome=sacCer3&hub=https://companion.epigenomegateway.org//task/6480d2f42f1177624560a55e7d51258f/output//datahub.json
Pycallingcards can be used to visual peak locations acorss the genome to see that the distribution of peaks is unbiased and that all chromosomes are represented.
[12]:
cc.pl.whole_peaks(peak_data, reference = 'sacCer3', height_scale = 1.7)
In the next step, we annotate the peaks by their closest genes using bedtools and pybedtools. Make sure they are all previously installed before using.
[13]:
peak_annotation = cc.pp.annotation(peak_data, reference = 'sacCer3')
peak_annotation = cc.pp.combine_annotation(peak_data, peak_annotation)
peak_annotation
In the bedtools method, we would use bedtools in the default path. Set bedtools path by 'bedtools_path' if needed.
[13]:
| Chr | Start | End | Center | pvalue | Experiment Insertions | Reference Insertions | Fraction Experiment | TPH Experiment | Expect insertions | pvalue_adj | Nearest Refseq1 | Gene Name1 | Direction1 | Distance1 | Nearest Refseq2 | Gene Name2 | Direction2 | Distance2 | |
|---|---|---|---|---|---|---|---|---|---|---|---|---|---|---|---|---|---|---|---|
| 0 | chrI | 68120 | 68335 | 68249.0 | 1.607677e-09 | 27 | 25 | 0.001137 | 1.137177e+05 | 7.429007 | 1.040712e-06 | S000000037 | CYC3 | - | 382 | S000000038 | CLN3 | - | -601 |
| 1 | chrI | 71058 | 71450 | 71268.0 | 0.000000e+00 | 57 | 27 | 0.002401 | 2.400708e+05 | 7.943327 | 0.000000e+00 | S000000036 | CDC19 | + | 337 | S000000037 | CYC3 | - | -1534 |
| 2 | chrI | 229758 | 229966 | 229890.0 | 1.183165e-12 | 43 | 45 | 0.001811 | 1.811060e+05 | 12.572212 | 8.633875e-10 | S000000094 | PHO11 | + | -2896 | S000000084 | FLO1 | + | -21743 |
| 3 | chrII | 29937 | 30481 | 30158.5 | 0.000000e+00 | 71 | 0 | 0.002990 | 2.990355e+05 | 1.252814 | 0.000000e+00 | S000000197 | ECM21 | - | -1639 | S000000198 | SFT2 | + | -5193 |
| 4 | chrII | 221245 | 221577 | 221472.0 | 0.000000e+00 | 86 | 8 | 0.003622 | 3.622120e+05 | 3.022509 | 0.000000e+00 | S000000101 | PDR3 | + | -846 | S000000102 | LDB7 | - | -4117 |
| ... | ... | ... | ... | ... | ... | ... | ... | ... | ... | ... | ... | ... | ... | ... | ... | ... | ... | ... | ... |
| 64 | chrXV | 987325 | 988055 | 987562.0 | 0.000000e+00 | 224 | 64 | 0.009434 | 9.434360e+05 | 20.135194 | 0.000000e+00 | S000005875 | PUT4 | - | 0 | S000005874 | PYK2 | - | -864 |
| 65 | chrXV | 988153 | 988367 | 988290.0 | 1.295000e-07 | 24 | 22 | 0.001011 | 1.010824e+05 | 7.577723 | 7.532581e-05 | S000005875 | PUT4 | - | 0 | S000005876 | CIN1 | + | 1423 |
| 66 | chrXVI | 411349 | 411915 | 411592.0 | 0.000000e+00 | 110 | 34 | 0.004633 | 4.632944e+05 | 11.167010 | 0.000000e+00 | S000005997 | GPI2 | + | -65 | S000005996 | GCR1 | + | 340 |
| 67 | chrXVI | 412048 | 412354 | 412177.0 | 0.000000e+00 | 75 | 19 | 0.003159 | 3.158826e+05 | 6.681564 | 0.000000e+00 | S000005996 | GCR1 | + | 0 | S000005997 | GPI2 | + | -764 |
| 68 | chrXVI | 855654 | 856341 | 855836.0 | 0.000000e+00 | 623 | 12 | 0.026239 | 2.623931e+06 | 4.588356 | 0.000000e+00 | S000006363 | KRE6 | + | 1243 | S000006364 | GPH1 | + | 4966 |
69 rows × 19 columns
Use qbed data, peak data and group names to make a group by peak anndata object.
[14]:
adata_cc = cc.pp.make_Anndata(qbed_data, peak_annotation, ['TYE7', 'TYE7_gcr2ko'], key = 'group', reference = "sacCer3")
adata_cc
100%|██████████| 15/15 [00:00<00:00, 151.88it/s]
[14]:
AnnData object with n_obs × n_vars = 2 × 69
    var: 'Chr', 'Start', 'End', 'Center', 'pvalue', 'Experiment Insertions', 'Reference Insertions', 'Fraction Experiment', 'TPH Experiment', 'Expect insertions', 'pvalue_adj', 'Nearest Refseq1', 'Gene Name1', 'Direction1', 'Distance1', 'Nearest Refseq2', 'Gene Name2', 'Direction2', 'Distance2'
Differential peak analysis would find out the significant binding for each group. In this example, we use fisher exact test to find out.
[15]:
cc.tl.rank_peak_groups(adata_cc, "Index", method = 'fisher_exact', key_added = 'fisher_exact')
100%|██████████| 2/2 [00:00<00:00, 5.13it/s]
Plot the results for differential peak analysis.
Currently, the peaks are ranked by pvalues. It could also be ranked by logfoldchanges by the following codes:
cc.tl.rank_peak_groups(adata_cc,"Index",method = 'fisher_exact',key_added = 'fisher_exact',rankby = 'logfoldchanges')
cc.pl.rank_peak_groups(adata_cc, key = 'fisher_exact',rankby = 'logfoldchanges')
[16]:
cc.pl.rank_peak_groups(adata_cc, key = 'fisher_exact')
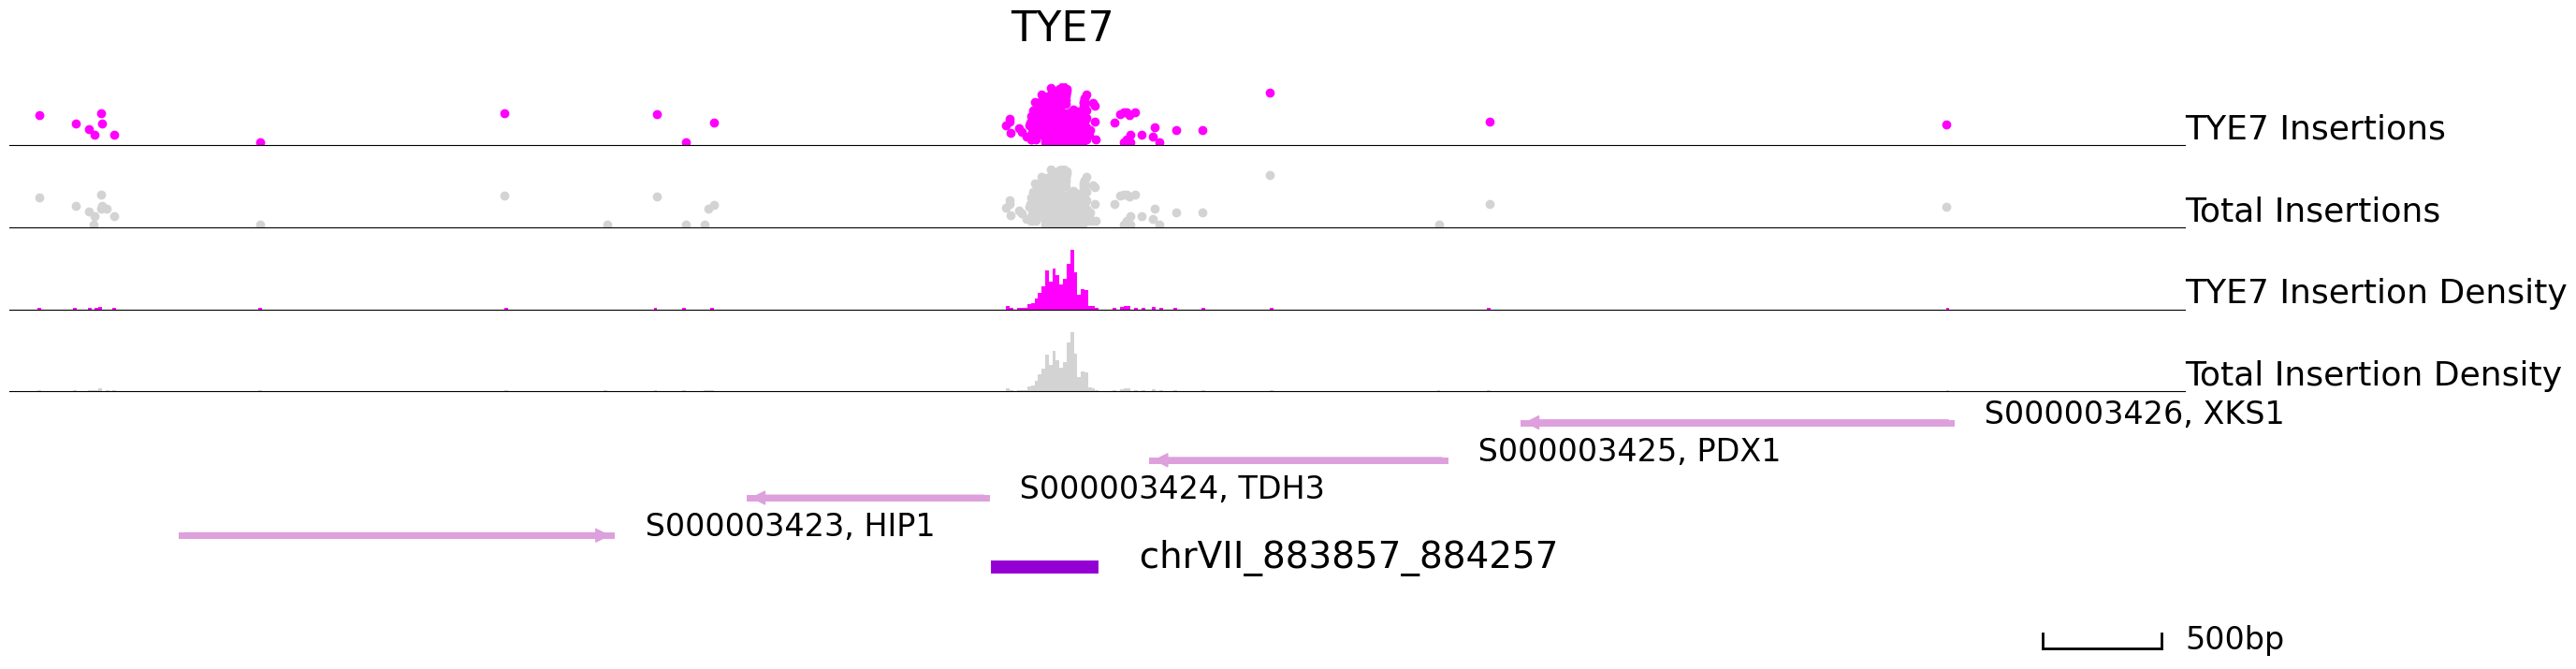
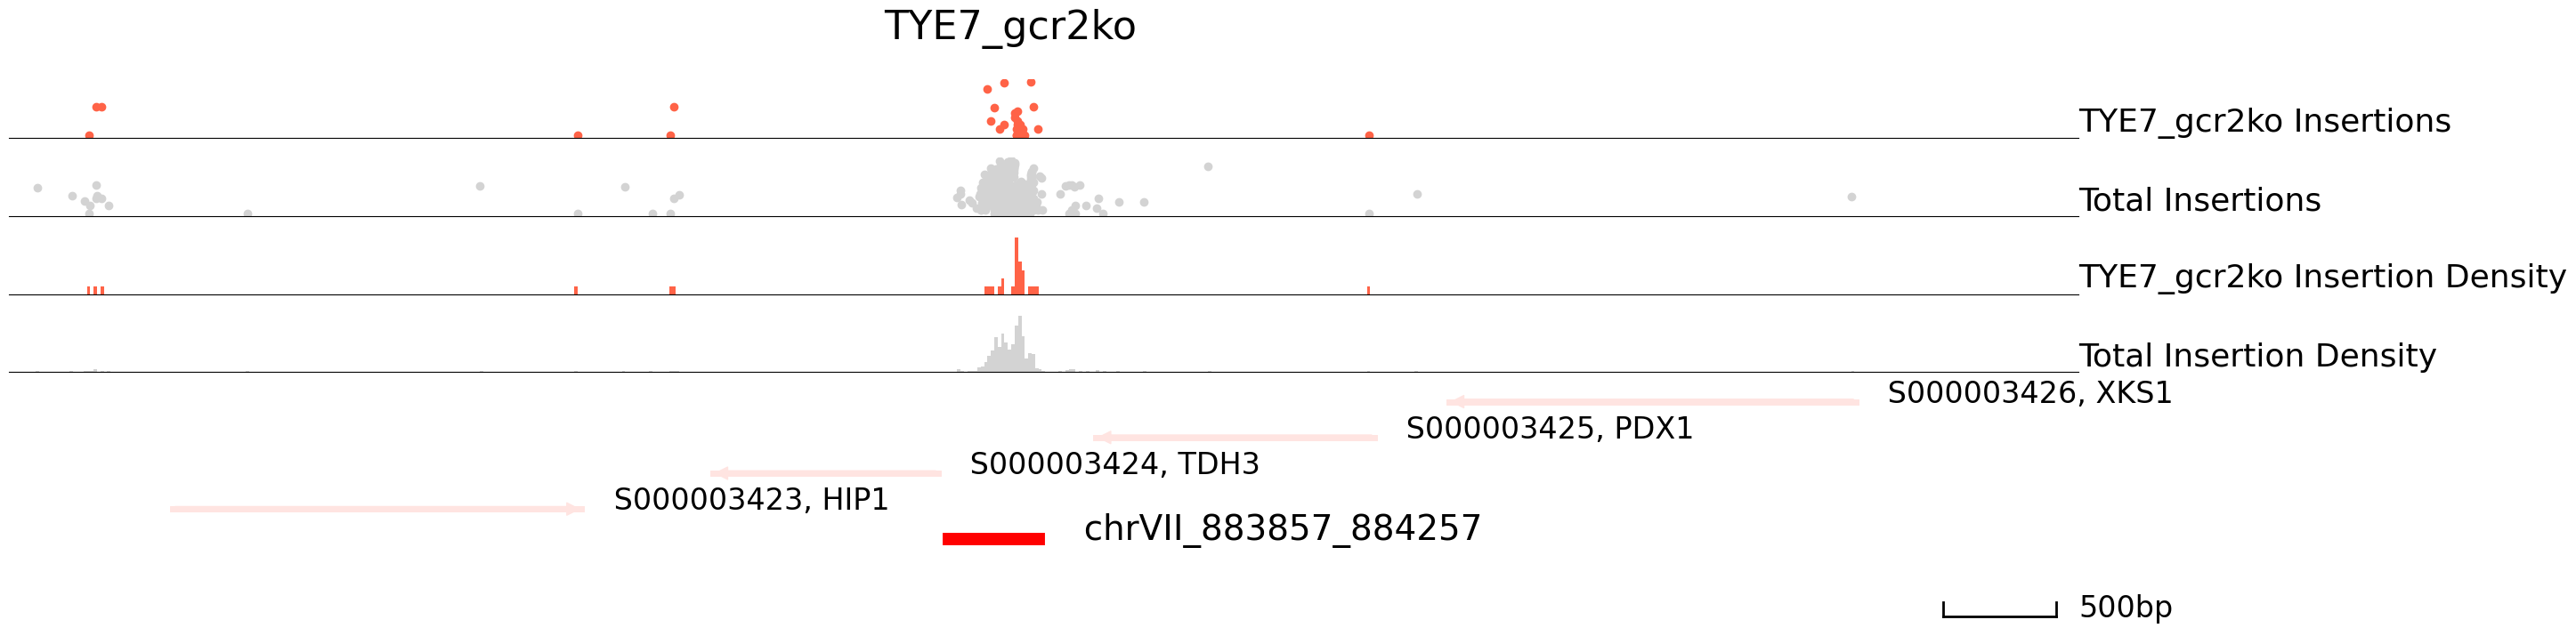
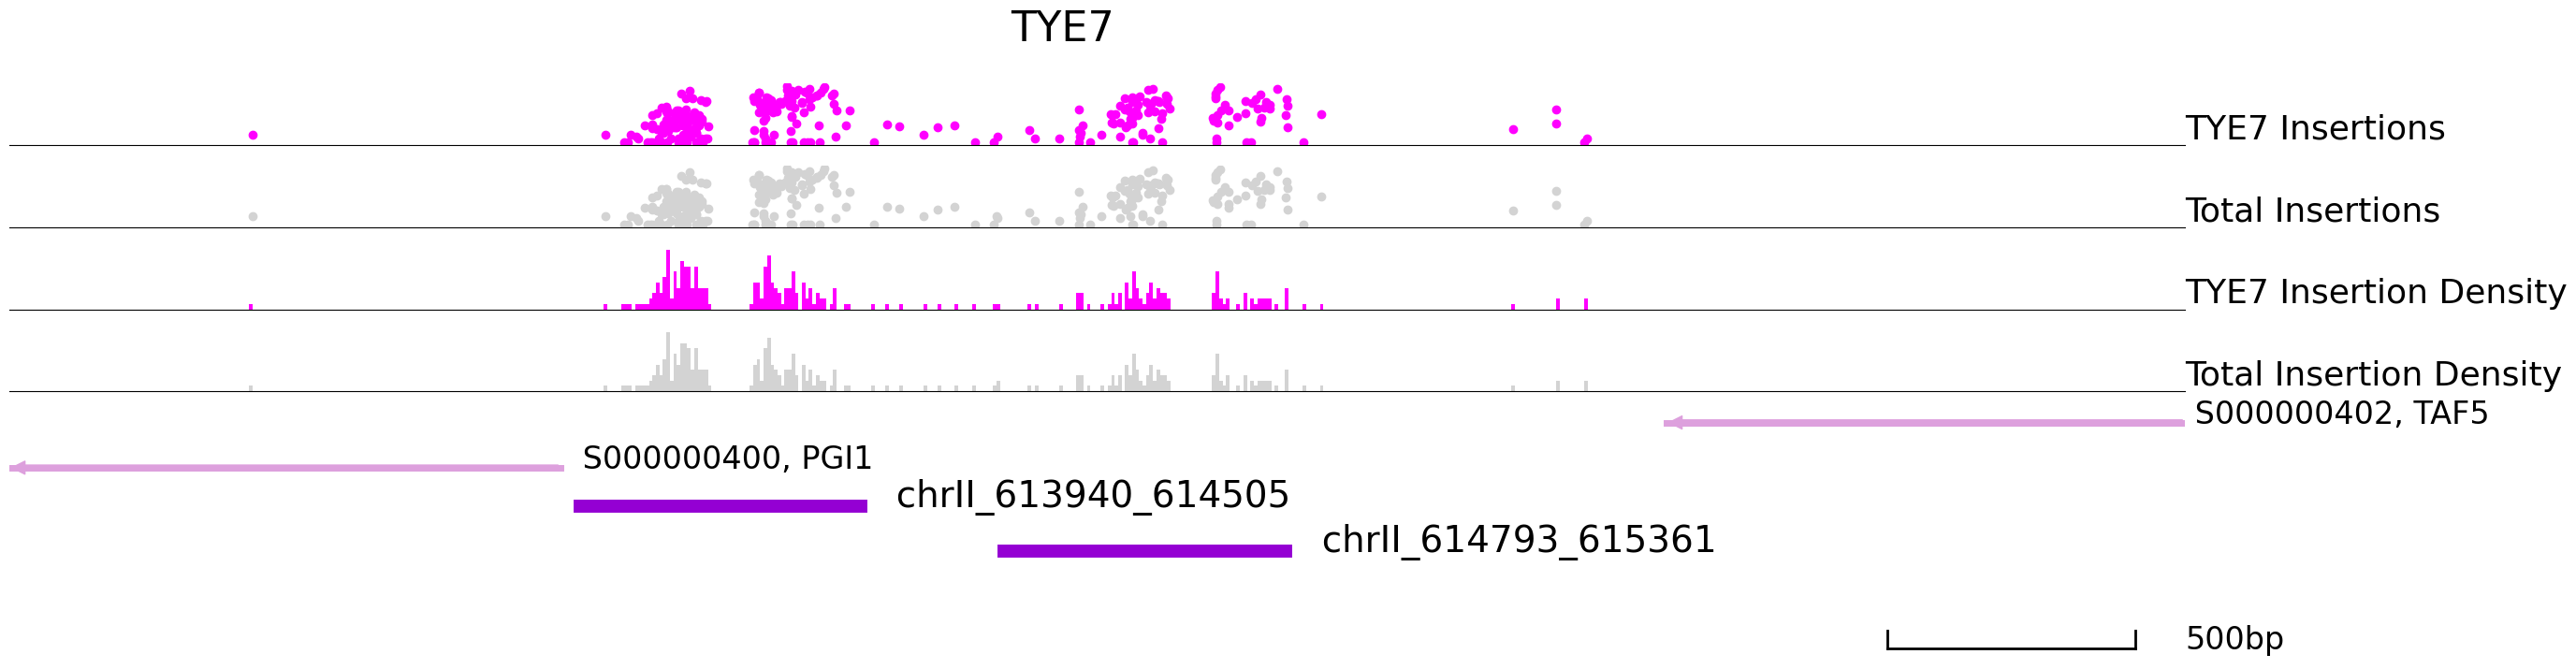
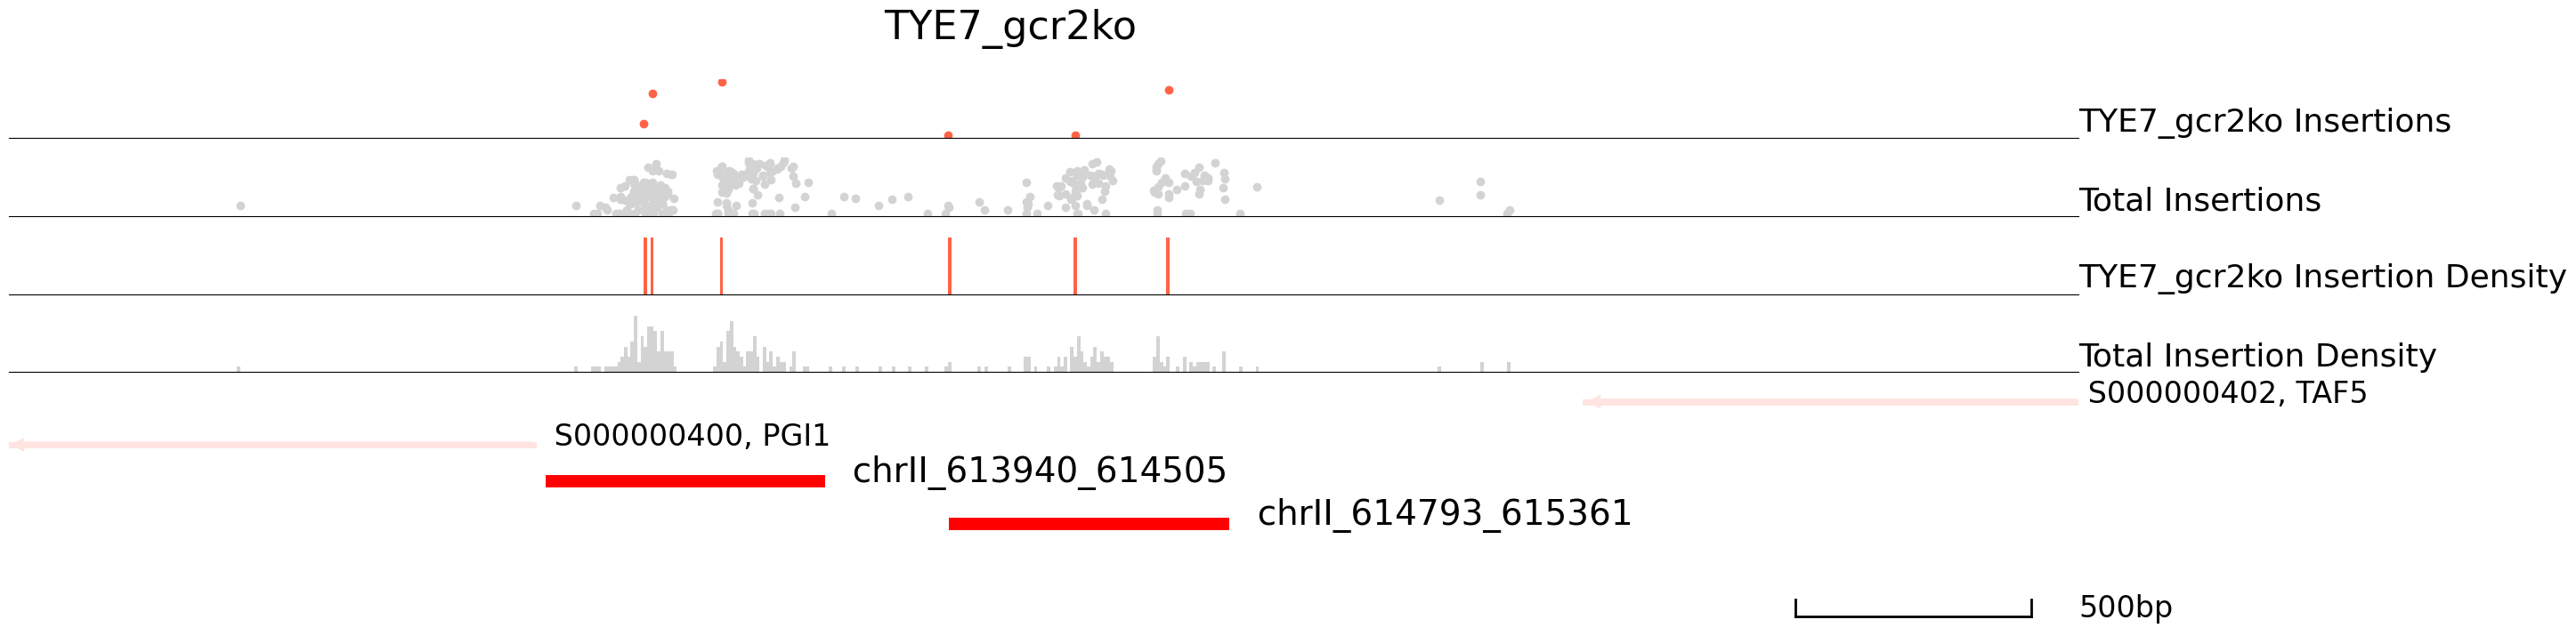
Then, we take a look at the genome for highly differentiated peaks. The colored ones are the insertions for specific cluster and the grey ones are the total insertions information. If we input the backgound file, the grey ones would be the backgound insertions.
[17]:
cc.pl.draw_area("chrVII", 883694, 884861, 4000, peak_data, qbed_data, "sacCer3", adata = adata_cc, font_size=2,
                name = "TYE7", key = "Index", insertionkey = "group", figsize = (30,8), peak_line = 1,
                name_insertion1 = 'TYE7 Insertions', name_density1 = 'TYE7 Insertion Density',
                name_insertion2 = 'Total Insertions', name_density2 = 'Total Insertion Density',
                bins = 600, example_length = 500, color = "purple", title = "TYE7")
cc.pl.draw_area("chrVII", 883694, 884861, 4000, peak_data, qbed_data, "sacCer3", adata = adata_cc, font_size=2,
                name = "TYE7_gcr2ko", key = "Index", insertionkey = "group", figsize = (30,8), peak_line = 1,
                name_insertion1 = 'TYE7_gcr2ko Insertions', name_density1 = 'TYE7_gcr2ko Insertion Density',
                name_insertion2 = 'Total Insertions', name_density2 = 'Total Insertion Density',
                bins = 600, example_length = 500, title = "TYE7_gcr2ko")
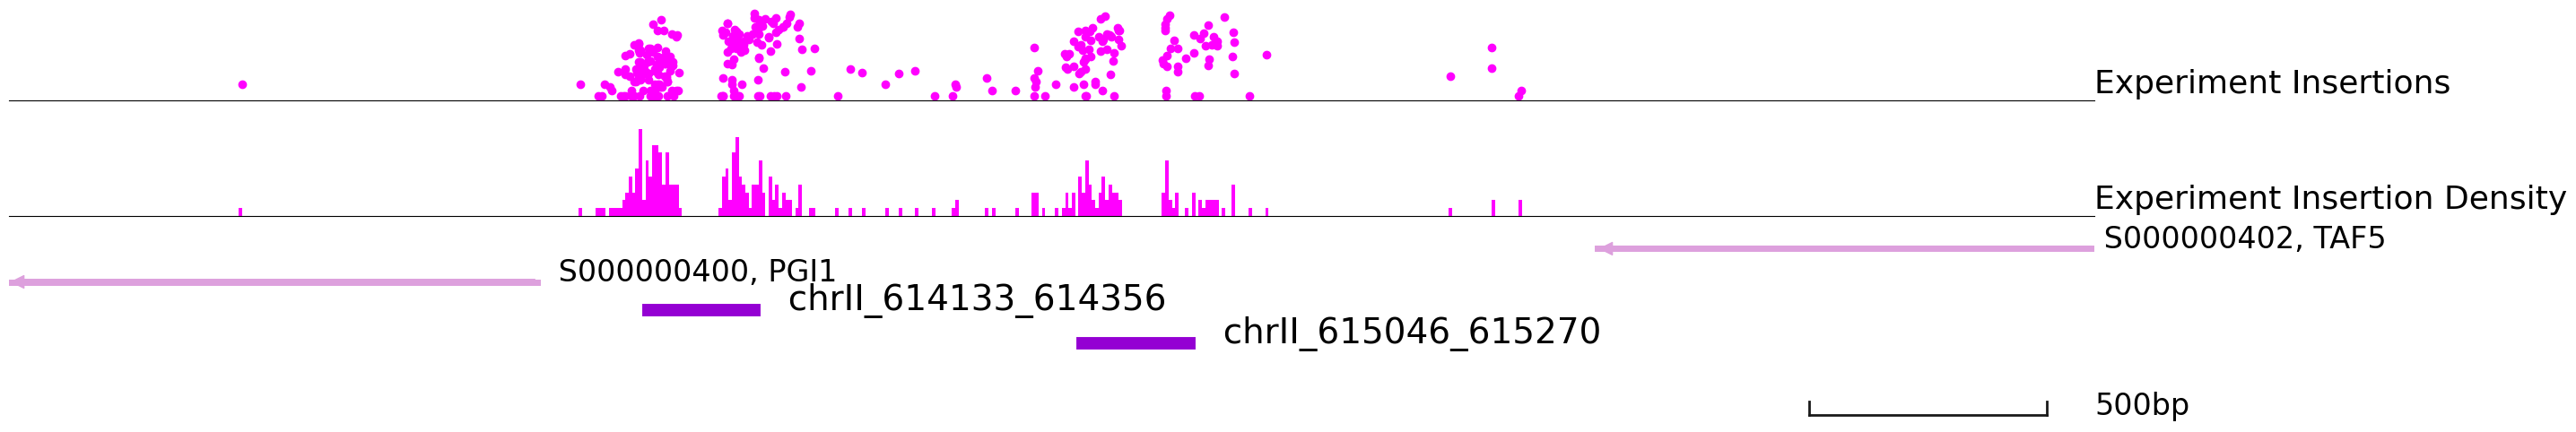
[18]:
cc.pl.draw_area("chrII", 613790, 616171, 1000, peak_data, qbed_data, "sacCer3",adata = adata_cc, font_size = 2,
                name = "TYE7", key = "Index", insertionkey = "group", figsize = (30,8), peak_line = 2,
                name_insertion2 = 'Total Insertions', name_density2 = 'Total Insertion Density',
                name_insertion1 = 'TYE7 Insertions', name_density1 = 'TYE7 Insertion Density',
                bins = 600, example_length = 500, color = "purple", title = "TYE7")
cc.pl.draw_area("chrII", 613790, 616171, 1000, peak_data, qbed_data, "sacCer3", adata = adata_cc, font_size = 2,
                name = "TYE7_gcr2ko", key = "Index", insertionkey = "group", figsize = (30,8), peak_line = 2,
                name_insertion1 = 'TYE7_gcr2ko Insertions', name_density1 = 'TYE7_gcr2ko Insertion Density',
                name_insertion2 = 'Total Insertions', name_density2 = 'Total Insertion Density',
                bins = 600, example_length = 500, title = "TYE7_gcr2ko")
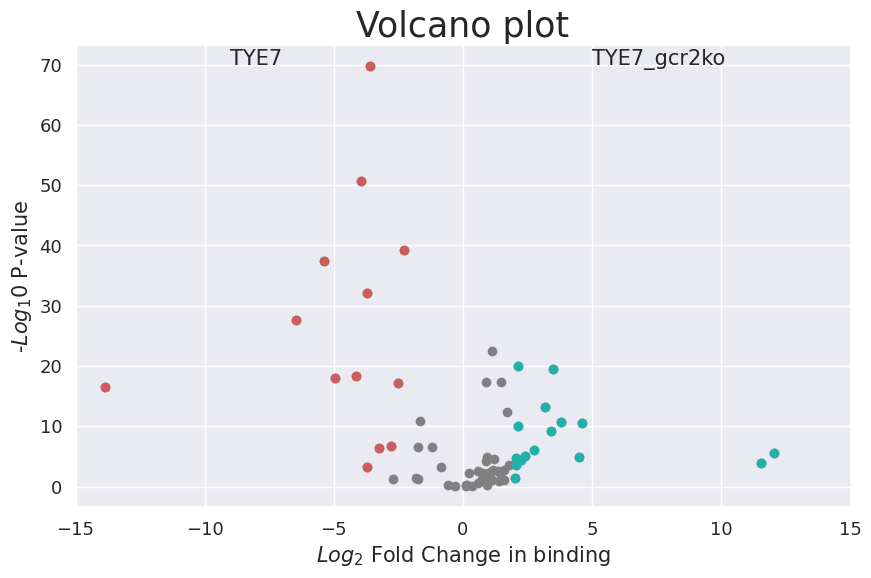
Plot the volcano plot for differential binding sites.
[19]:
cc.pl.volcano_plot(adata_cc, pvalue_cutoff = 0.05, lfc_cutoff = 2, labelright = (5,70), labelleft = (-9,70))
[20]:
cc.tl.rank_peak_groups_df(adata_cc,'fisher_exact', logfc_min = 3, pval_cutoff = 0.05)
[20]:
| names | logfoldchanges | pvalues | pvalues_adj | number | number_rest | total | total_rest | group | |
|---|---|---|---|---|---|---|---|---|---|
| 0 | chrVII_883857_884257 | 3.606330 | 1.927126e-70 | 1.329717e-68 | 441 | 24 | 5031 | 3335 | TYE7 |
| 1 | chrX_454688_455338 | 3.949230 | 2.108841e-51 | 7.275501e-50 | 303 | 13 | 5031 | 3335 | TYE7 |
| 2 | chrII_613940_614505 | 5.382557 | 4.503557e-38 | 7.768636e-37 | 189 | 3 | 5031 | 3335 | TYE7 |
| 3 | chrV_544670_545587 | 3.728325 | 9.272983e-33 | 1.279672e-31 | 200 | 10 | 5031 | 3335 | TYE7 |
| 4 | chrVIII_450860_451208 | 6.446487 | 2.321509e-28 | 2.669735e-27 | 132 | 1 | 5031 | 3335 | TYE7 |
| 5 | chrXVI_411349_411915 | 4.133628 | 5.321212e-19 | 3.671637e-18 | 106 | 4 | 5031 | 3335 | TYE7 |
| 6 | chrII_614793_615361 | 4.959104 | 1.137108e-18 | 7.132768e-18 | 94 | 2 | 5031 | 3335 | TYE7 |
| 7 | chrXVI_412048_412354 | 13.863855 | 2.628075e-17 | 1.208914e-16 | 75 | 0 | 5031 | 3335 | TYE7 |
| 8 | chrXV_160747_161147 | 3.246710 | 4.388851e-07 | 1.164734e-06 | 43 | 3 | 5031 | 3335 | TYE7 |
| 9 | chrXI_164749_164897 | 3.724329 | 4.839595e-04 | 8.562361e-04 | 20 | 1 | 5031 | 3335 | TYE7 |
| 10 | chrIV_215708_216063 | 3.480023 | 3.447024e-20 | 2.642718e-19 | 74 | 10 | 3335 | 5031 | TYE7_gcr2ko |
| 11 | chrVII_625218_625597 | 3.177404 | 7.027647e-14 | 3.030673e-13 | 54 | 9 | 3335 | 5031 | TYE7_gcr2ko |
| 12 | chrII_533304_533666 | 3.800928 | 2.132744e-11 | 7.745227e-11 | 37 | 4 | 3335 | 5031 | TYE7_gcr2ko |
| 13 | chrXIV_301779_302150 | 4.589684 | 3.215739e-11 | 1.109430e-10 | 32 | 2 | 3335 | 5031 | TYE7_gcr2ko |
| 14 | chrXV_304395_304786 | 3.399200 | 5.453564e-10 | 1.710436e-09 | 35 | 5 | 3335 | 5031 | TYE7_gcr2ko |
| 15 | chrIV_1270863_1270994 | 12.035796 | 2.517398e-06 | 6.203588e-06 | 14 | 0 | 3335 | 5031 | TYE7_gcr2ko |
| 16 | chrII_455444_455788 | 4.493130 | 1.004659e-05 | 2.310716e-05 | 15 | 1 | 3335 | 5031 | TYE7_gcr2ko |
| 17 | chrIV_927099_927255 | 11.550507 | 1.005197e-04 | 1.926627e-04 | 10 | 0 | 3335 | 5031 | TYE7_gcr2ko |
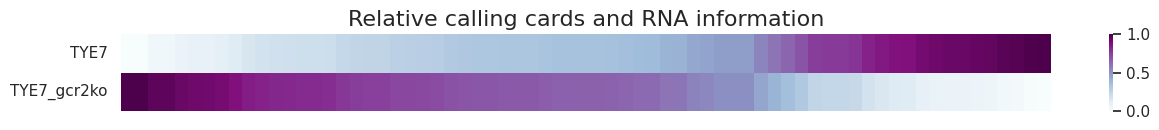
This is the heatmap for relative calling cards bindings.
[21]:
cc.pl.heatmap(adata_cc, figsize=(15,1))
[22]:
cc.tl.rank_peak_groups_df(adata_cc,'fisher_exact')
[22]:
| names | logfoldchanges | pvalues | pvalues_adj | number | number_rest | total | total_rest | group | |
|---|---|---|---|---|---|---|---|---|---|
| 0 | chrVII_883857_884257 | 3.606330 | 1.927126e-70 | 1.329717e-68 | 441 | 24 | 5031 | 3335 | TYE7 |
| 1 | chrX_454688_455338 | 3.949230 | 2.108841e-51 | 7.275501e-50 | 303 | 13 | 5031 | 3335 | TYE7 |
| 2 | chrVII_999899_1001006 | 2.295043 | 6.436514e-40 | 1.480398e-38 | 385 | 52 | 5031 | 3335 | TYE7 |
| 3 | chrII_613940_614505 | 5.382557 | 4.503557e-38 | 7.768636e-37 | 189 | 3 | 5031 | 3335 | TYE7 |
| 4 | chrV_544670_545587 | 3.728325 | 9.272983e-33 | 1.279672e-31 | 200 | 10 | 5031 | 3335 | TYE7 |
| ... | ... | ... | ... | ... | ... | ... | ... | ... | ... |
| 133 | chrXV_970959_971080 | -0.576370 | 5.822512e-01 | 6.180820e-01 | 4 | 9 | 3335 | 5031 | TYE7_gcr2ko |
| 134 | chrXV_117912_118160 | 0.136291 | 6.403453e-01 | 6.694519e-01 | 51 | 70 | 3335 | 5031 | TYE7_gcr2ko |
| 135 | chrXI_381717_381964 | 0.330000 | 6.645344e-01 | 6.843713e-01 | 10 | 12 | 3335 | 5031 | TYE7_gcr2ko |
| 136 | chrVIII_549242_549430 | -0.313615 | 6.755711e-01 | 6.855059e-01 | 8 | 15 | 3335 | 5031 | TYE7_gcr2ko |
| 137 | chrVII_567315_567563 | 0.123640 | 8.551552e-01 | 8.551552e-01 | 13 | 18 | 3335 | 5031 | TYE7_gcr2ko |
138 rows × 9 columns
[23]:
cc.tl.rank_peak_groups_df(adata_cc,'fisher_exact', logfc_min = 3, pval_cutoff = 0.05)
[23]:
| names | logfoldchanges | pvalues | pvalues_adj | number | number_rest | total | total_rest | group | |
|---|---|---|---|---|---|---|---|---|---|
| 0 | chrVII_883857_884257 | 3.606330 | 1.927126e-70 | 1.329717e-68 | 441 | 24 | 5031 | 3335 | TYE7 |
| 1 | chrX_454688_455338 | 3.949230 | 2.108841e-51 | 7.275501e-50 | 303 | 13 | 5031 | 3335 | TYE7 |
| 2 | chrII_613940_614505 | 5.382557 | 4.503557e-38 | 7.768636e-37 | 189 | 3 | 5031 | 3335 | TYE7 |
| 3 | chrV_544670_545587 | 3.728325 | 9.272983e-33 | 1.279672e-31 | 200 | 10 | 5031 | 3335 | TYE7 |
| 4 | chrVIII_450860_451208 | 6.446487 | 2.321509e-28 | 2.669735e-27 | 132 | 1 | 5031 | 3335 | TYE7 |
| 5 | chrXVI_411349_411915 | 4.133628 | 5.321212e-19 | 3.671637e-18 | 106 | 4 | 5031 | 3335 | TYE7 |
| 6 | chrII_614793_615361 | 4.959104 | 1.137108e-18 | 7.132768e-18 | 94 | 2 | 5031 | 3335 | TYE7 |
| 7 | chrXVI_412048_412354 | 13.863855 | 2.628075e-17 | 1.208914e-16 | 75 | 0 | 5031 | 3335 | TYE7 |
| 8 | chrXV_160747_161147 | 3.246710 | 4.388851e-07 | 1.164734e-06 | 43 | 3 | 5031 | 3335 | TYE7 |
| 9 | chrXI_164749_164897 | 3.724329 | 4.839595e-04 | 8.562361e-04 | 20 | 1 | 5031 | 3335 | TYE7 |
| 10 | chrIV_215708_216063 | 3.480023 | 3.447024e-20 | 2.642718e-19 | 74 | 10 | 3335 | 5031 | TYE7_gcr2ko |
| 11 | chrVII_625218_625597 | 3.177404 | 7.027647e-14 | 3.030673e-13 | 54 | 9 | 3335 | 5031 | TYE7_gcr2ko |
| 12 | chrII_533304_533666 | 3.800928 | 2.132744e-11 | 7.745227e-11 | 37 | 4 | 3335 | 5031 | TYE7_gcr2ko |
| 13 | chrXIV_301779_302150 | 4.589684 | 3.215739e-11 | 1.109430e-10 | 32 | 2 | 3335 | 5031 | TYE7_gcr2ko |
| 14 | chrXV_304395_304786 | 3.399200 | 5.453564e-10 | 1.710436e-09 | 35 | 5 | 3335 | 5031 | TYE7_gcr2ko |
| 15 | chrIV_1270863_1270994 | 12.035796 | 2.517398e-06 | 6.203588e-06 | 14 | 0 | 3335 | 5031 | TYE7_gcr2ko |
| 16 | chrII_455444_455788 | 4.493130 | 1.004659e-05 | 2.310716e-05 | 15 | 1 | 3335 | 5031 | TYE7_gcr2ko |
| 17 | chrIV_927099_927255 | 11.550507 | 1.005197e-04 | 1.926627e-04 | 10 | 0 | 3335 | 5031 | TYE7_gcr2ko |
[24]:
adata_cc.var
[24]:
| Chr | Start | End | Center | pvalue | Experiment Insertions | Reference Insertions | Fraction Experiment | TPH Experiment | Expect insertions | pvalue_adj | Nearest Refseq1 | Gene Name1 | Direction1 | Distance1 | Nearest Refseq2 | Gene Name2 | Direction2 | Distance2 | |
|---|---|---|---|---|---|---|---|---|---|---|---|---|---|---|---|---|---|---|---|
| name | |||||||||||||||||||
| chrIII_137273_137488 | chrIII | 137273 | 137488 | 137384.0 | 1.040404e-07 | 19 | 18 | 0.000800 | 8.002359e+04 | 5.077267 | 6.140676e-05 | S000000605 | PGK1 | + | 259 | S000000604 | ADP1 | - | -401 |
| chrIII_50464_50773 | chrIII | 50464 | 50773 | 50622.0 | 0.000000e+00 | 57 | 17 | 0.002401 | 2.400708e+05 | 4.850752 | 0.000000e+00 | S000000545 | GLK1 | + | 66 | S000000548 | PDI1 | - | -244 |
| chrIII_68547_68827 | chrIII | 68547 | 68827 | 68644.0 | 0.000000e+00 | 59 | 33 | 0.002485 | 2.484943e+05 | 8.474990 | 0.000000e+00 | S000000534 | BIK1 | - | 0 | S000000535 | HIS4 | - | -215 |
| chrII_221245_221577 | chrII | 221245 | 221577 | 221472.0 | 0.000000e+00 | 86 | 8 | 0.003622 | 3.622120e+05 | 3.022509 | 0.000000e+00 | S000000101 | PDR3 | + | -846 | S000000102 | LDB7 | - | -4117 |
| chrII_260413_260575 | chrII | 260413 | 260575 | 260489.0 | 5.870277e-09 | 22 | 18 | 0.000927 | 9.265889e+04 | 5.550644 | 3.681306e-06 | S000000215 | IPP1 | - | -2439 | S000000214 | HHT1 | + | -3673 |
| ... | ... | ... | ... | ... | ... | ... | ... | ... | ... | ... | ... | ... | ... | ... | ... | ... | ... | ... | ... |
| chrXV_970959_971080 | chrXV | 970959 | 971080 | 971024.5 | 1.148182e-11 | 13 | 0 | 0.000548 | 5.475298e+04 | 1.298987 | 7.945218e-09 | S000005868 | RPA190 | + | -4979 | S000005871 | TYE7 | - | 6115 |
| chrXV_987325_988055 | chrXV | 987325 | 988055 | 987562.0 | 0.000000e+00 | 224 | 64 | 0.009434 | 9.434360e+05 | 20.135194 | 0.000000e+00 | S000005875 | PUT4 | - | 0 | S000005874 | PYK2 | - | -864 |
| chrXV_988153_988367 | chrXV | 988153 | 988367 | 988290.0 | 1.295000e-07 | 24 | 22 | 0.001011 | 1.010824e+05 | 7.577723 | 7.532581e-05 | S000005875 | PUT4 | - | 0 | S000005876 | CIN1 | + | 1423 |
| chrX_337351_338085 | chrX | 337351 | 338085 | 337757.0 | 0.000000e+00 | 738 | 44 | 0.031083 | 3.108285e+06 | 19.316612 | 0.000000e+00 | S000003588 | TDH1 | + | 187 | S000003589 | PEP8 | + | -315 |
| chrX_454688_455338 | chrX | 454688 | 455338 | 454954.0 | 0.000000e+00 | 316 | 23 | 0.013309 | 1.330919e+06 | 10.574593 | 0.000000e+00 | S000003769 | TDH2 | - | -8 | S000003771 | MET3 | + | 902 |
69 rows × 19 columns
[25]:
adata_cc.var[adata_cc.var.index.isin(list(cc.tl.rank_peak_groups_df(adata_cc,'fisher_exact', logfc_min = 3, pval_cutoff = 0.05)['names']))]
[25]:
| Chr | Start | End | Center | pvalue | Experiment Insertions | Reference Insertions | Fraction Experiment | TPH Experiment | Expect insertions | pvalue_adj | Nearest Refseq1 | Gene Name1 | Direction1 | Distance1 | Nearest Refseq2 | Gene Name2 | Direction2 | Distance2 | |
|---|---|---|---|---|---|---|---|---|---|---|---|---|---|---|---|---|---|---|---|
| name | |||||||||||||||||||
| chrII_455444_455788 | chrII | 455444 | 455788 | 455660.5 | 2.775558e-15 | 16 | 0 | 0.000674 | 6.738828e+04 | 1.252814 | 2.101830e-12 | S000000312 | AIM3 | + | 0 | S000000311 | IML3 | - | -915 |
| chrII_533304_533666 | chrII | 533304 | 533666 | 533482.5 | 0.000000e+00 | 41 | 11 | 0.001727 | 1.726825e+05 | 3.780949 | 0.000000e+00 | S000000349 | ADH5 | + | 97 | S000000347 | SUP45 | - | -1123 |
| chrII_613940_614505 | chrII | 613940 | 614505 | 614184.0 | 0.000000e+00 | 192 | 41 | 0.008087 | 8.086594e+05 | 11.365356 | 0.000000e+00 | S000000400 | PGI1 | - | -41 | S000000402 | TAF5 | - | 1623 |
| chrII_614793_615361 | chrII | 614793 | 615361 | 615087.0 | 0.000000e+00 | 96 | 10 | 0.004043 | 4.043297e+05 | 3.528136 | 0.000000e+00 | S000000402 | TAF5 | - | 767 | S000000400 | PGI1 | - | -894 |
| chrIV_1270863_1270994 | chrIV | 1270863 | 1270994 | 1270932.5 | 2.821892e-10 | 14 | 4 | 0.000590 | 5.896475e+04 | 1.926398 | 1.919604e-07 | S000002808 | URH1 | + | 70 | S000002807 | HPT1 | + | -131 |
| chrIV_215708_216063 | chrIV | 215708 | 216063 | 215952.0 | 0.000000e+00 | 84 | 26 | 0.003538 | 3.537885e+05 | 7.021585 | 0.000000e+00 | S000002297 | RGT2 | + | -67 | S000002296 | ARF2 | + | 467 |
| chrIV_927099_927255 | chrIV | 927099 | 927255 | 927176.0 | 5.238660e-08 | 10 | 2 | 0.000421 | 4.211768e+04 | 1.463199 | 3.185661e-05 | S000002639 | COX20 | - | -190 | S000002640 | HEM1 | + | 198 |
| chrVIII_450860_451208 | chrVIII | 450860 | 451208 | 451015.0 | 0.000000e+00 | 133 | 22 | 0.005602 | 5.601651e+05 | 5.946786 | 0.000000e+00 | S000001215 | SPC97 | + | -55 | S000001217 | ENO2 | - | 120 |
| chrVII_625218_625597 | chrVII | 625218 | 625597 | 625465.0 | 0.000000e+00 | 63 | 8 | 0.002653 | 2.653414e+05 | 4.569200 | 0.000000e+00 | S000003300 | ART5 | - | 0 | S000003302 | ROM1 | + | 2210 |
| chrVII_883857_884257 | chrVII | 883857 | 884257 | 884120.0 | 0.000000e+00 | 465 | 41 | 0.019585 | 1.958472e+06 | 19.292152 | 0.000000e+00 | S000003424 | TDH3 | - | -48 | S000003425 | PDX1 | - | 253 |
| chrV_544670_545587 | chrV | 544670 | 545587 | 545228.0 | 0.000000e+00 | 210 | 106 | 0.008845 | 8.844712e+05 | 25.204724 | 0.000000e+00 | S000000978 | ECM32 | + | 0 | S000000979 | BMH1 | + | 25 |
| chrXIV_301779_302150 | chrXIV | 301779 | 302150 | 301988.0 | 4.203859e-12 | 34 | 25 | 0.001432 | 1.432001e+05 | 8.725072 | 2.960033e-09 | S000005122 | RPS3 | + | 531 | S000005124 | RHO5 | - | -1131 |
| chrXI_164749_164897 | chrXI | 164749 | 164897 | 164815.5 | 1.333711e-12 | 21 | 11 | 0.000884 | 8.844712e+04 | 3.292782 | 9.558659e-10 | S000001635 | GPM1 | - | -365 | S000001633 | MCR1 | + | 1648 |
| chrXVI_411349_411915 | chrXVI | 411349 | 411915 | 411592.0 | 0.000000e+00 | 110 | 34 | 0.004633 | 4.632944e+05 | 11.167010 | 0.000000e+00 | S000005997 | GPI2 | + | -65 | S000005996 | GCR1 | + | 340 |
| chrXVI_412048_412354 | chrXVI | 412048 | 412354 | 412177.0 | 0.000000e+00 | 75 | 19 | 0.003159 | 3.158826e+05 | 6.681564 | 0.000000e+00 | S000005996 | GCR1 | + | 0 | S000005997 | GPI2 | + | -764 |
| chrXV_160747_161147 | chrXV | 160747 | 161147 | 160921.0 | 0.000000e+00 | 46 | 23 | 0.001937 | 1.937413e+05 | 7.876710 | 0.000000e+00 | S000005446 | ADH1 | - | -154 | S000005444 | PHM7 | + | 1210 |
| chrXV_304395_304786 | chrXV | 304395 | 304786 | 304559.0 | 0.000000e+00 | 40 | 10 | 0.001685 | 1.684707e+05 | 3.989874 | 0.000000e+00 | S000005372 | HTZ1 | - | -413 | S000005371 | PLB3 | + | 564 |
| chrX_454688_455338 | chrX | 454688 | 455338 | 454954.0 | 0.000000e+00 | 316 | 23 | 0.013309 | 1.330919e+06 | 10.574593 | 0.000000e+00 | S000003769 | TDH2 | - | -8 | S000003771 | MET3 | + | 902 |
In some cases, the peaks are divided into two and the gap might be acture binding sites. This often happens in yeast data because insertions can bind anywhere, but it rarely happens in human/mouse data, because it can only bind in TTAA sites.
We could perform a footprint analysis on yeast data.
[26]:
adata_cc.var = cc.tl.footprint(adata_cc.var, qbed_data)
adata_cc.var
[26]:
| Chr | Start | End | Center | pvalue | Experiment Insertions | Reference Insertions | Fraction Experiment | TPH Experiment | Expect insertions | ... | Gene Name1 | Direction1 | Distance1 | Nearest Refseq2 | Gene Name2 | Direction2 | Distance2 | Chr_footprint | Start_footprint | End_footprint | |
|---|---|---|---|---|---|---|---|---|---|---|---|---|---|---|---|---|---|---|---|---|---|
| name | |||||||||||||||||||||
| chrIII_137273_137488 | chrIII | 137273 | 137488 | 137384.0 | 1.040404e-07 | 19 | 18 | 0.000800 | 8.002359e+04 | 5.077267 | ... | PGK1 | + | 259 | S000000604 | ADP1 | - | -401 | chrIII | 137342 | 137398 |
| chrIII_50464_50773 | chrIII | 50464 | 50773 | 50622.0 | 0.000000e+00 | 57 | 17 | 0.002401 | 2.400708e+05 | 4.850752 | ... | GLK1 | + | 66 | S000000548 | PDI1 | - | -244 | chrIII | 50528 | 50645 |
| chrIII_68547_68827 | chrIII | 68547 | 68827 | 68644.0 | 0.000000e+00 | 59 | 33 | 0.002485 | 2.484943e+05 | 8.474990 | ... | BIK1 | - | 0 | S000000535 | HIS4 | - | -215 | chrIII | 68634 | 68742 |
| chrII_221245_221577 | chrII | 221245 | 221577 | 221472.0 | 0.000000e+00 | 86 | 8 | 0.003622 | 3.622120e+05 | 3.022509 | ... | PDR3 | + | -846 | S000000102 | LDB7 | - | -4117 | chrII | 221449 | 221557 |
| chrII_260413_260575 | chrII | 260413 | 260575 | 260489.0 | 5.870277e-09 | 22 | 18 | 0.000927 | 9.265889e+04 | 5.550644 | ... | IPP1 | - | -2439 | S000000214 | HHT1 | + | -3673 | chrII | 260466 | 260535 |
| ... | ... | ... | ... | ... | ... | ... | ... | ... | ... | ... | ... | ... | ... | ... | ... | ... | ... | ... | ... | ... | ... |
| chrXV_970959_971080 | chrXV | 970959 | 971080 | 971024.5 | 1.148182e-11 | 13 | 0 | 0.000548 | 5.475298e+04 | 1.298987 | ... | RPA190 | + | -4979 | S000005871 | TYE7 | - | 6115 | chrXV | 970959 | 971080 |
| chrXV_987325_988055 | chrXV | 987325 | 988055 | 987562.0 | 0.000000e+00 | 224 | 64 | 0.009434 | 9.434360e+05 | 20.135194 | ... | PUT4 | - | 0 | S000005874 | PYK2 | - | -864 | chrXV | 987523 | 987900 |
| chrXV_988153_988367 | chrXV | 988153 | 988367 | 988290.0 | 1.295000e-07 | 24 | 22 | 0.001011 | 1.010824e+05 | 7.577723 | ... | PUT4 | - | 0 | S000005876 | CIN1 | + | 1423 | chrXV | 988214 | 988319 |
| chrX_337351_338085 | chrX | 337351 | 338085 | 337757.0 | 0.000000e+00 | 738 | 44 | 0.031083 | 3.108285e+06 | 19.316612 | ... | TDH1 | + | 187 | S000003589 | PEP8 | + | -315 | chrX | 337611 | 337820 |
| chrX_454688_455338 | chrX | 454688 | 455338 | 454954.0 | 0.000000e+00 | 316 | 23 | 0.013309 | 1.330919e+06 | 10.574593 | ... | TDH2 | - | -8 | S000003771 | MET3 | + | 902 | chrX | 454946 | 455020 |
69 rows × 22 columns
Above is the footprint data saved in adata_cc. Here we do it again and perserve it in bed data.
[27]:
footprint_bed = cc.tl.footprint(peak_data, qbed_data, return_bed = True, delete_unfound = True)
footprint_bed[0:10]
[27]:
| Chr_footprint | Start_footprint | End_footprint | |
|---|---|---|---|
| 0 | chrI | 68246 | 68324 |
| 1 | chrI | 71216 | 71400 |
| 2 | chrI | 229803 | 229906 |
| 3 | chrII | 30129 | 30410 |
| 4 | chrII | 221449 | 221557 |
| 5 | chrII | 260466 | 260535 |
| 6 | chrII | 455557 | 455688 |
| 7 | chrII | 533329 | 533500 |
| 8 | chrII | 614133 | 614356 |
| 9 | chrII | 615046 | 615270 |
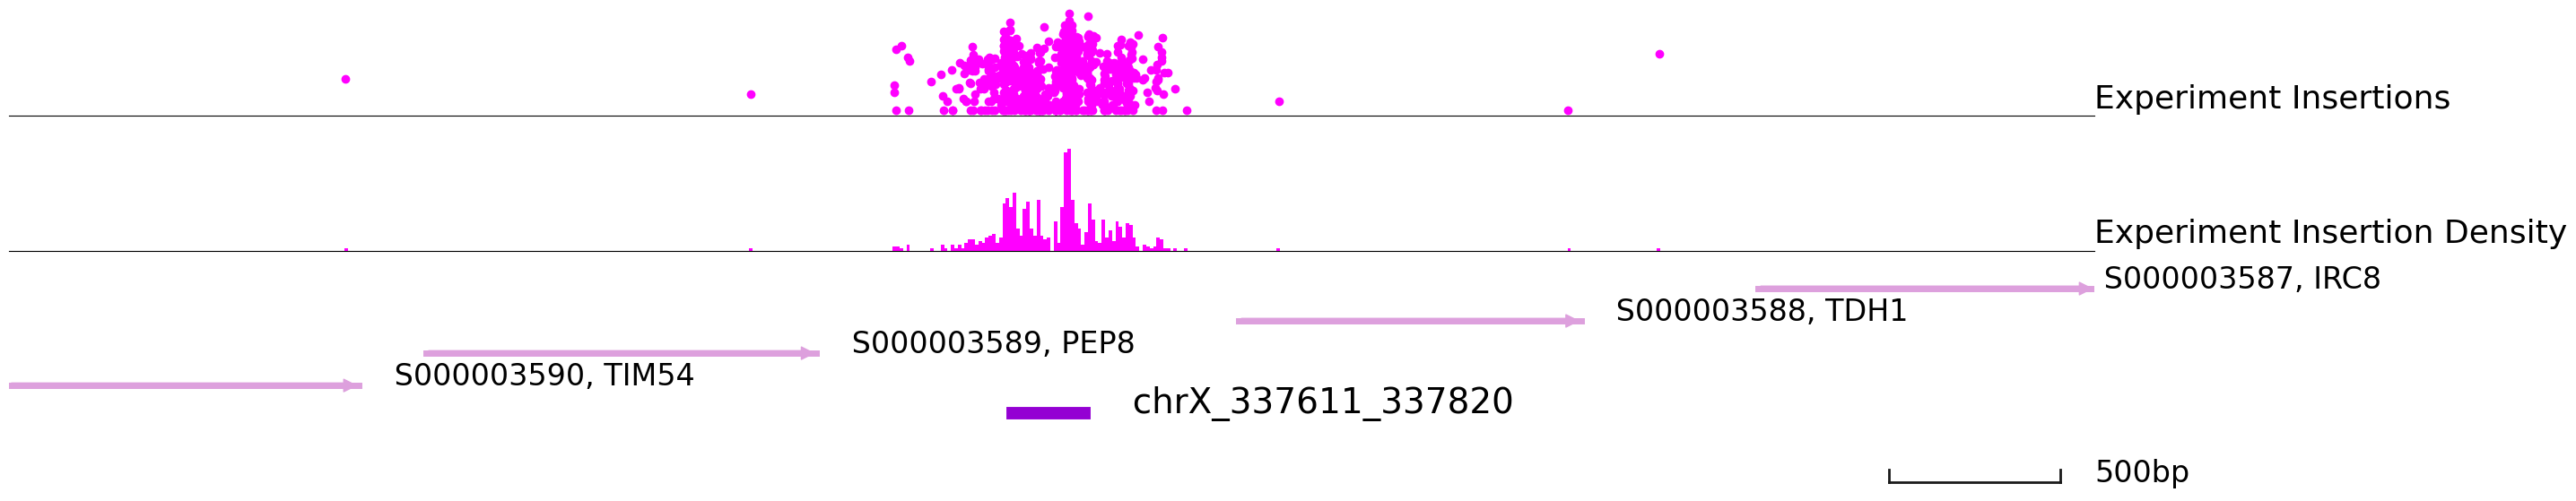
Let’s visulize part of the footprint points.
[28]:
cc.pl.draw_area("chrII", 613790, 616171, 1000, footprint_bed, qbed_data, "sacCer3", font_size=2,
                key = "Index", insertionkey = "group", figsize = (30,6), peak_line = 2, bins = 600,
                example_length = 500, color = "purple")
cc.pl.draw_area("chrX", 337680, 337768, 3000, footprint_bed, qbed_data, "sacCer3", font_size=2,
                key = "Index", insertionkey = "group", figsize = (30,7), peak_line = 1, bins = 600,
                example_length = 500, color = "purple")
Saved the file if needed.
[29]:
adata_cc.write("yeast.h5ad")